# Function to generate grid of colors
generate_color_grid <- function(size, colors) {
  # Create a size^2 matrix filled with a random sample of colors from a list
  color_vector <- sample(x = colors,
                         size = size * size,
                         replace = TRUE)
  grid <- matrix(color_vector,
                 nrow = size,
                 ncol = size)

  return(grid)
}The Ellsworth Project: Part 1
R
Shiny
A series documenting my learning process as I code The Ellsworth App, which generates random artwork inspired by Ellsworth Kelly’s Spectrum Colors by Chance Series - featuring loads of hand-written coding.
Welcome to the Ellsworth Project!
In this series, I’ll be sharing my journey of developing a Shiny app from scratch. There are plenty of tutorials out there showing you polished code. I want to show you the absolute mess (that you don’t usually get to see) that leads up to that polished code.
I’m super into transparency and busting impostor syndrome, which I prefer to call “unnecessary feelings of inadequacy.” You might look at a code project online and think, “Wow, they’re so smart, I could never do that,” but you’re not seeing the hours and hours of hilarious mistakes and all the struggles that went on behind the scenes (behind the screens? hahaha). Which also means we’re not gonna start with finished Shiny code. Or any Shiny code at all. We’re gonna start where I started: inspiration, notes by hand, and a quick proof of concept.
Developing is messy and fun! There is a lot of trial and error, loads of failure, and a fair bit of confusion. Both my handwritten and coded notes, as you’ll see, are not curated or edited, they’re just raw, and that means some stuff is random, doesn’t work, or is left unexplained. And that’s OK!. What follows are my development notes. Basically a journal I kept as I thought about the project and coded. Don’t expect it all to make sense - the point is the vulnerability and the mess, not the coherency.
What is it that I’m making exactly?
I want to create an app that will generate a piece of artwork akin to Ellsworth Kelly’s Spectrum Colors Arranged by Chance III from 1951, a paper on paper collage, seen here in different white balances. Paper yellows over time, so I’m thinking it was once more vibrant. Plus, as a photographer, I know light defines color and that screens and cameras are treacherous.
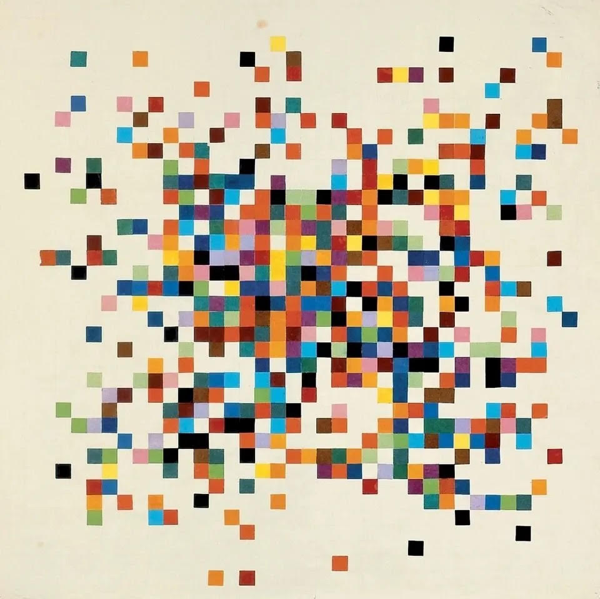

Isn’t it FUN?! I am fascinated by Kelly’s exploration of randomness within boundaries and his love of color. The pieces in this series were all created with random chance, constrained by logical boundaries, and they were created totally by hand (it was 1951, he wasn’t exactly whipping out Excel). Basically: put a bunch of squares of colored paper in a hat and draw them at random using different rules for the pattern of placement.
[Note from Future Libby: Alright! From here on out, I’ll use dates to separate days of work. Mostly because that’s how my development notes in Notion are sorted. In today’s post, I’ll just cover two days.
February 14th 2024
This was the first day I saw Kelly’s artwork. It was when Stacey Taylor (aka The Crooked Hem) posted on Instagram about the Ellsworth-inspired quilt she was creating. I got the sudden - and strong - itch to code something. I thought, “I bet I could create an app that would let users not only generate their own random “pieces” but also give them a grid of letters or numbers that would allow them to create their own quilt (think paint-by-numbers) with whatever colors they wanted.” I messaged Stacey to chat about it and she shared some blog posts she had read when doing her own research. I fell down a deep rabbit hole reading about this body of work. I’m pretty sure I didn’t sleep well that night just because I had this on my mind.
February 19th, 2024
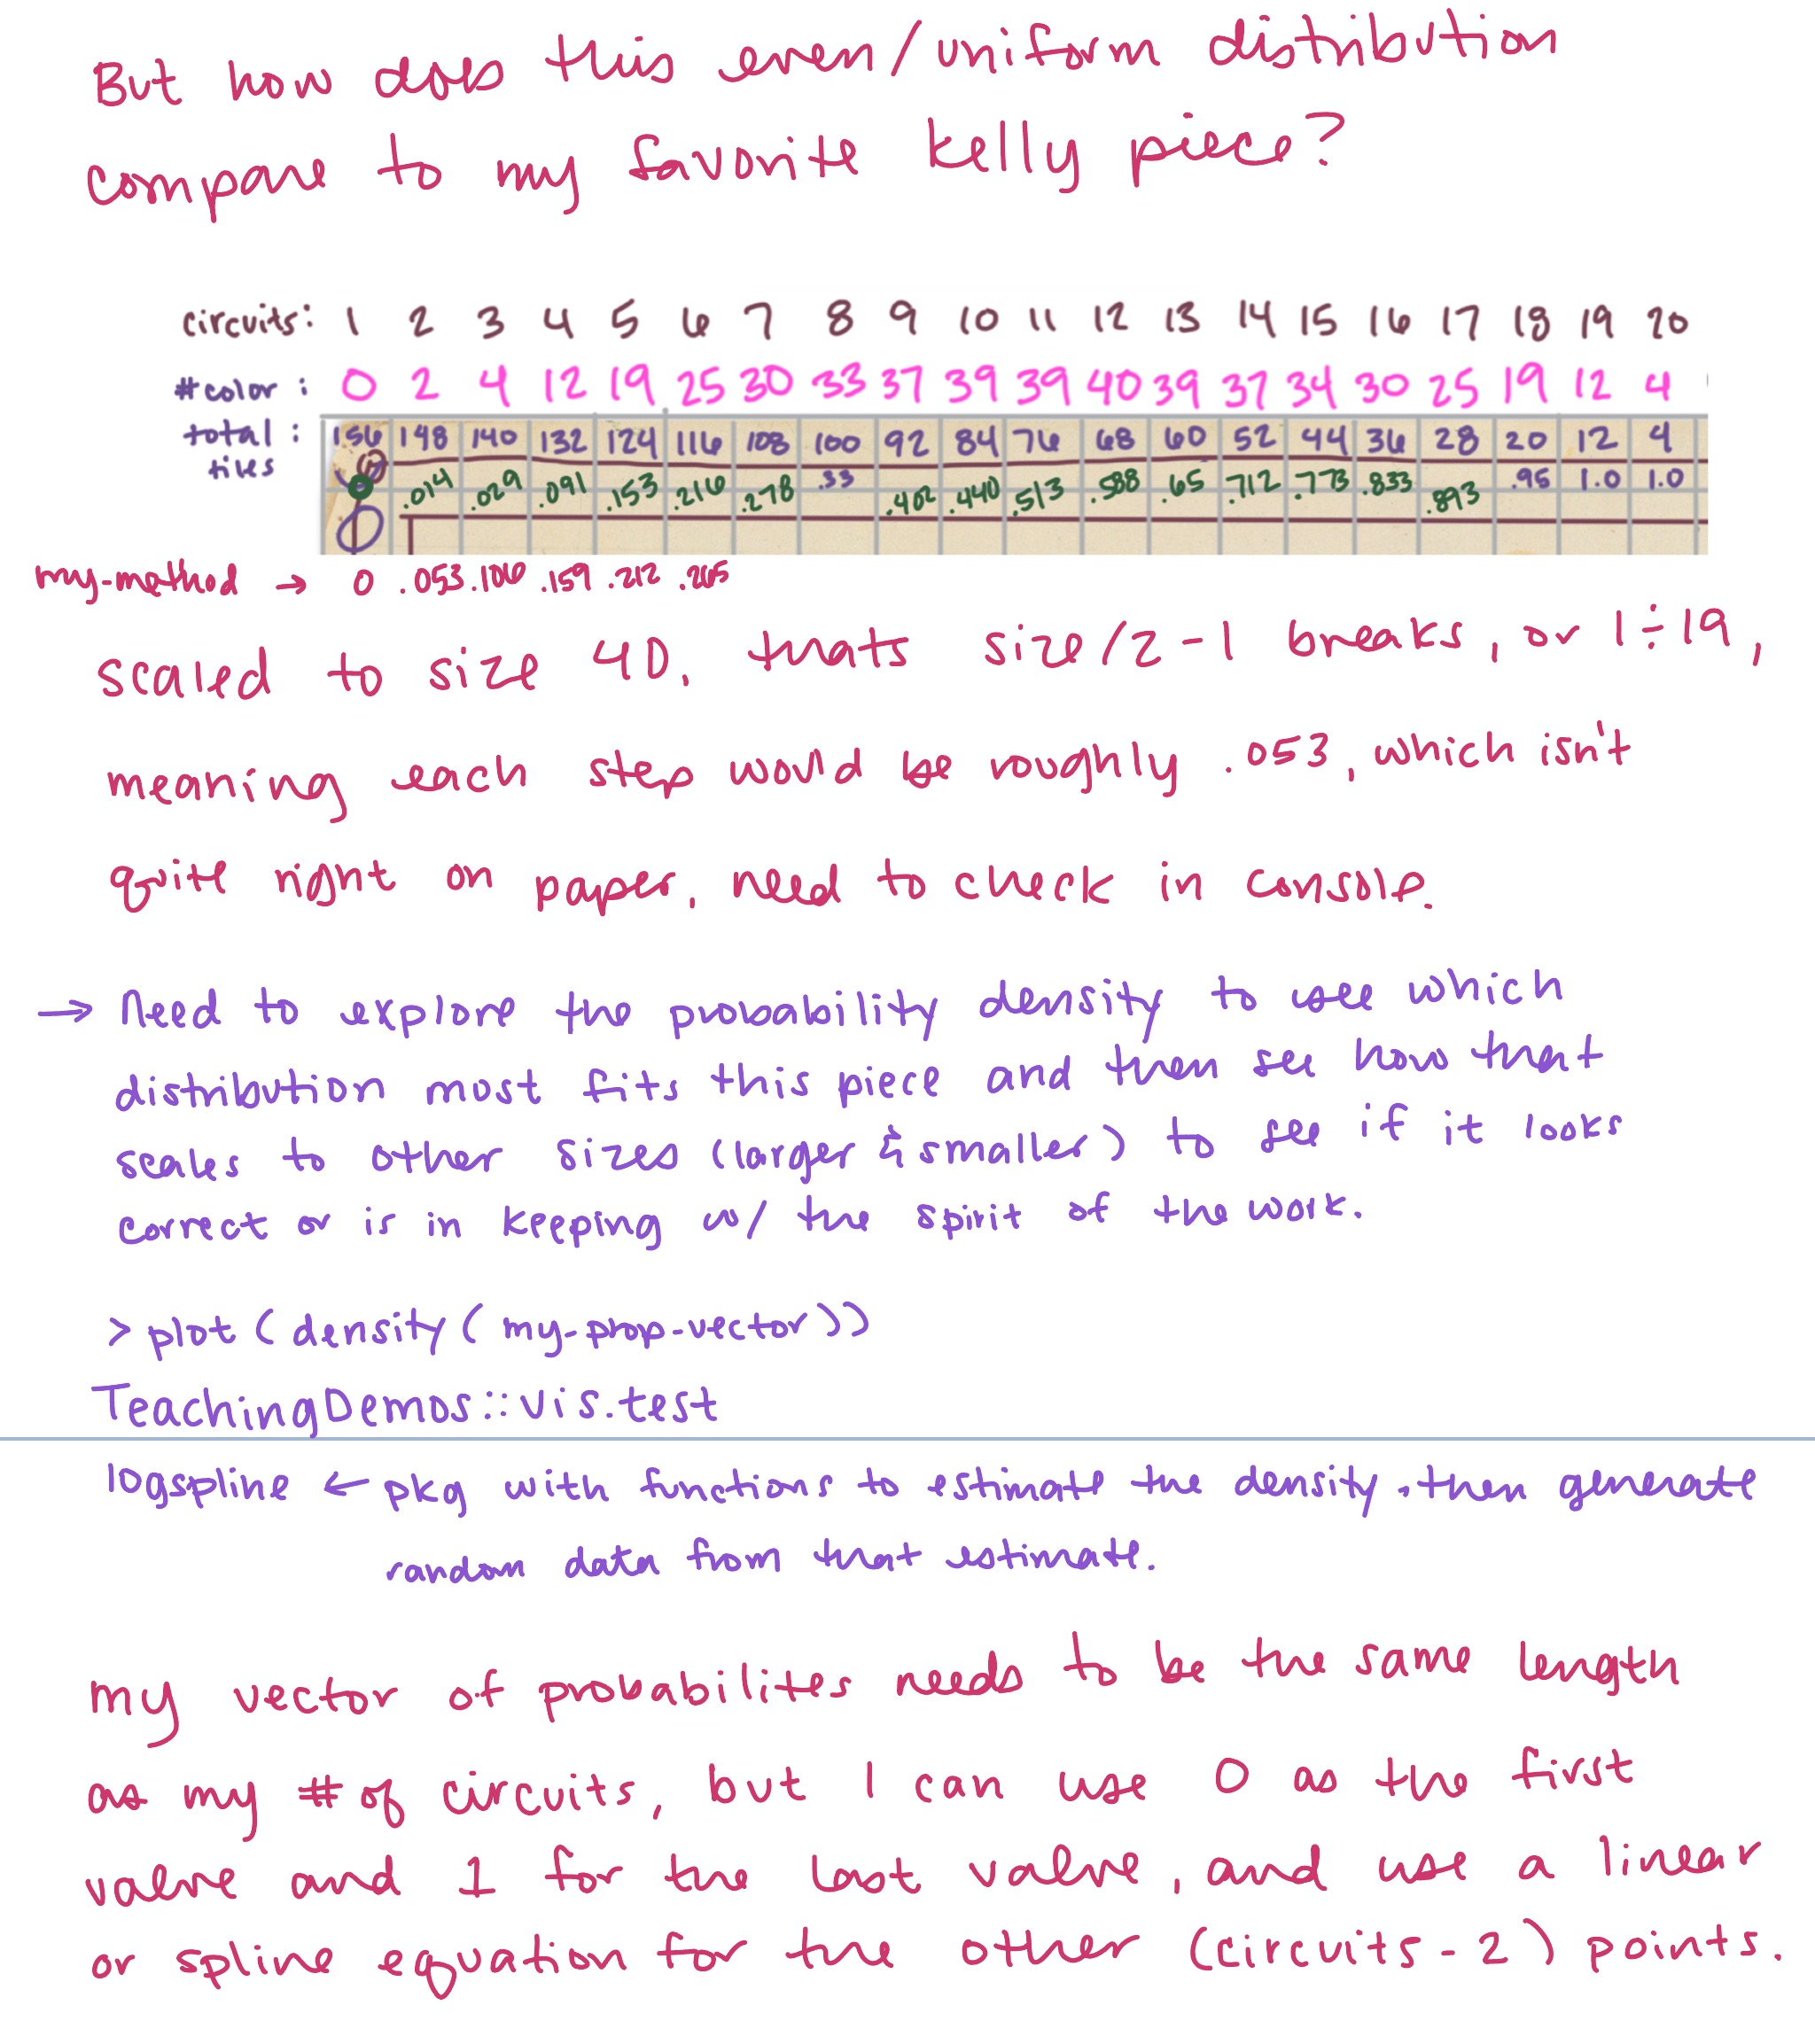
Days later, still unable to shake this ridiculous desire to build the app, I began to give in to the madness. I grabbed a snapshot of piece III (my favorite one of the whole series) and pulled it into Procreate. I counted all the things and made a huge mess. I hilariously miscounted twice, causing me to think my math was wrong, which made it hard for me to realize that each concentric square of cubes increases by 8 in number with each additional circuit/ring. Later, AFTER doing all this, I read in someone’s blog that Kelly himself mentioned this in an interview 😂 Sure wish I’d read that first.
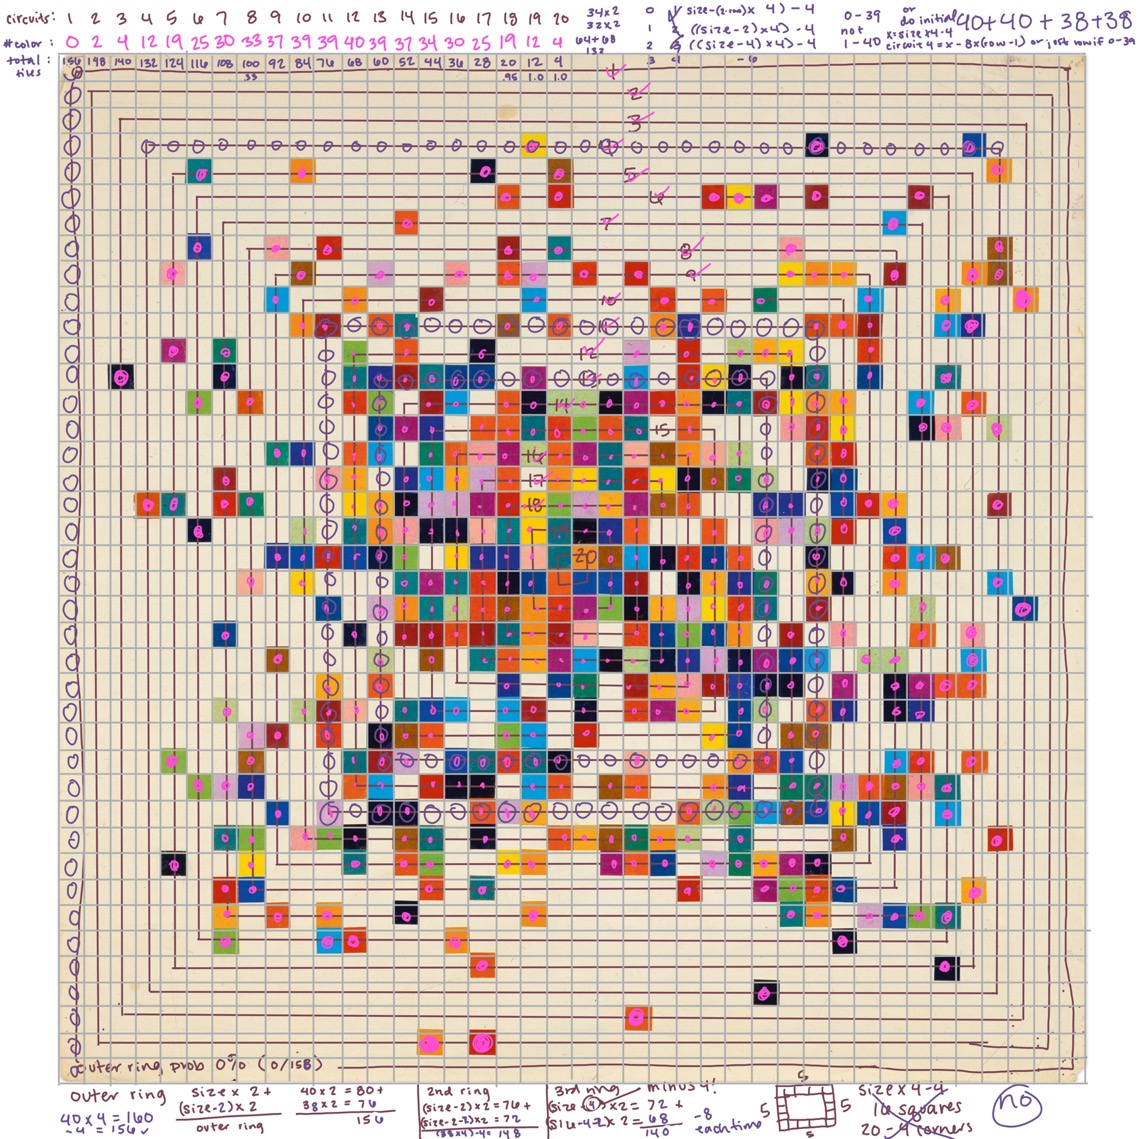
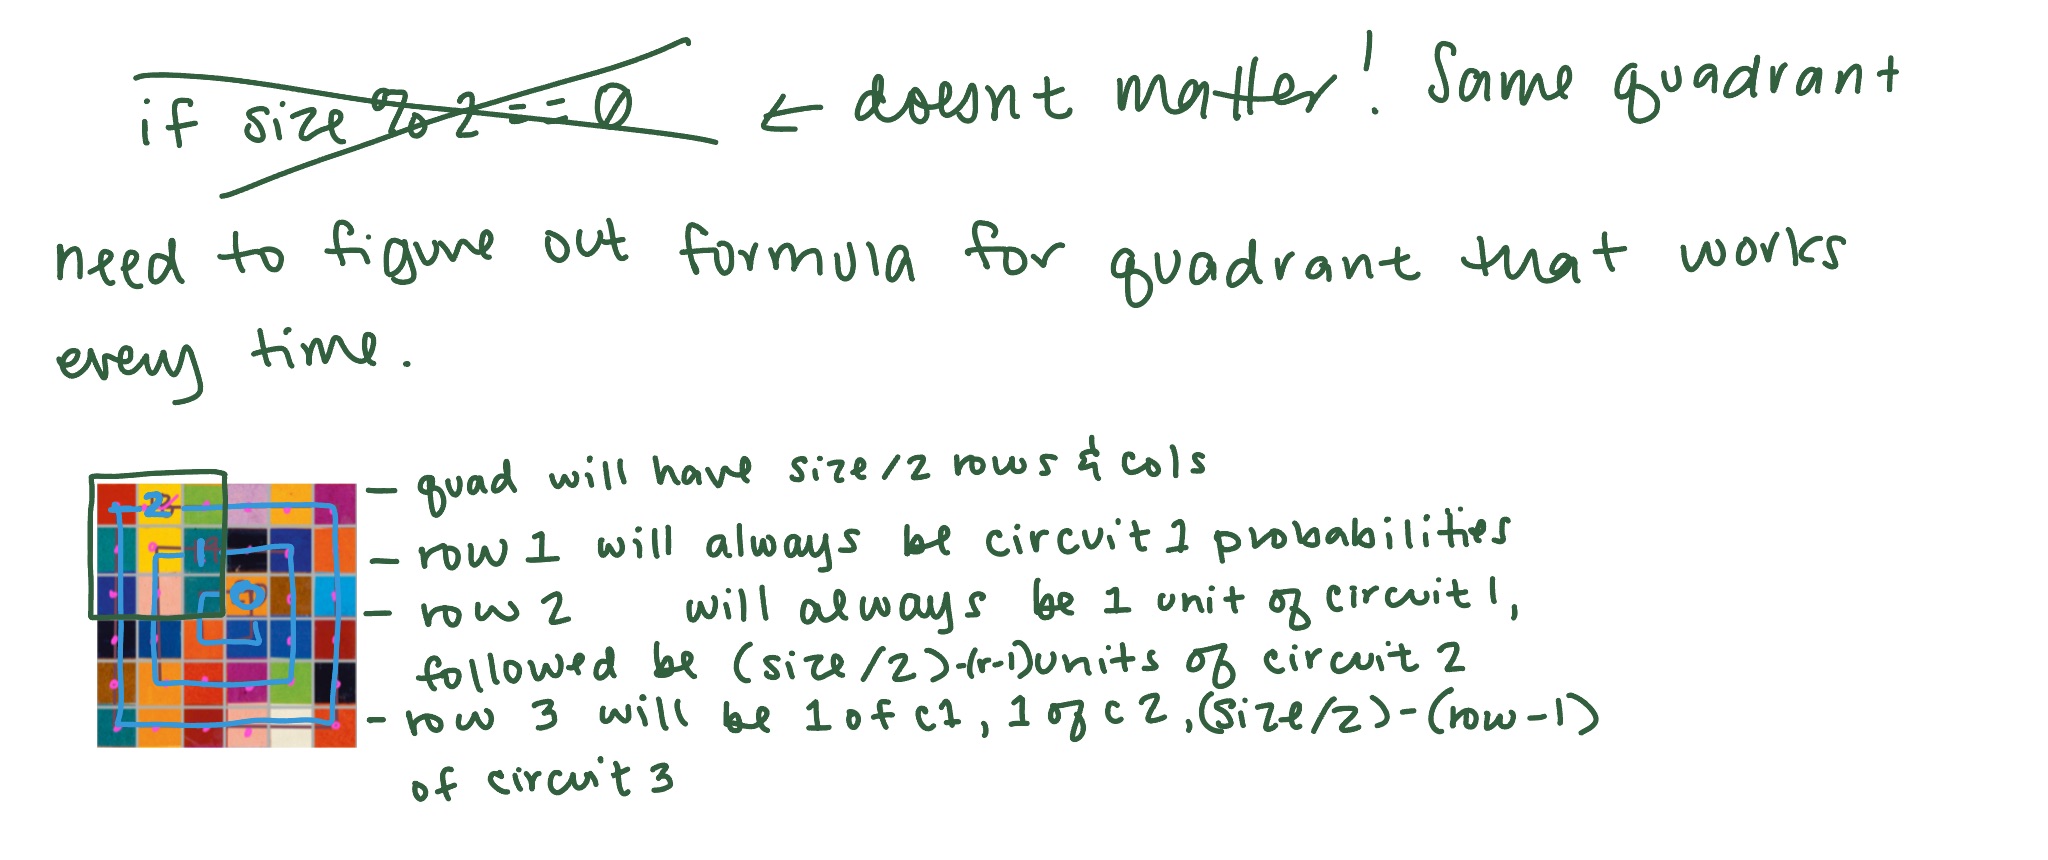
I drew a bunch of little diagrams and did a bunch of basic math to determine that the increase is always 8, regardless of whether each side of the grid has an even or an odd number of cubes. Again, wow, wish I’d read that interview with Kelly saying this much earlier. I began calling the concentric squares of cubes circuits.
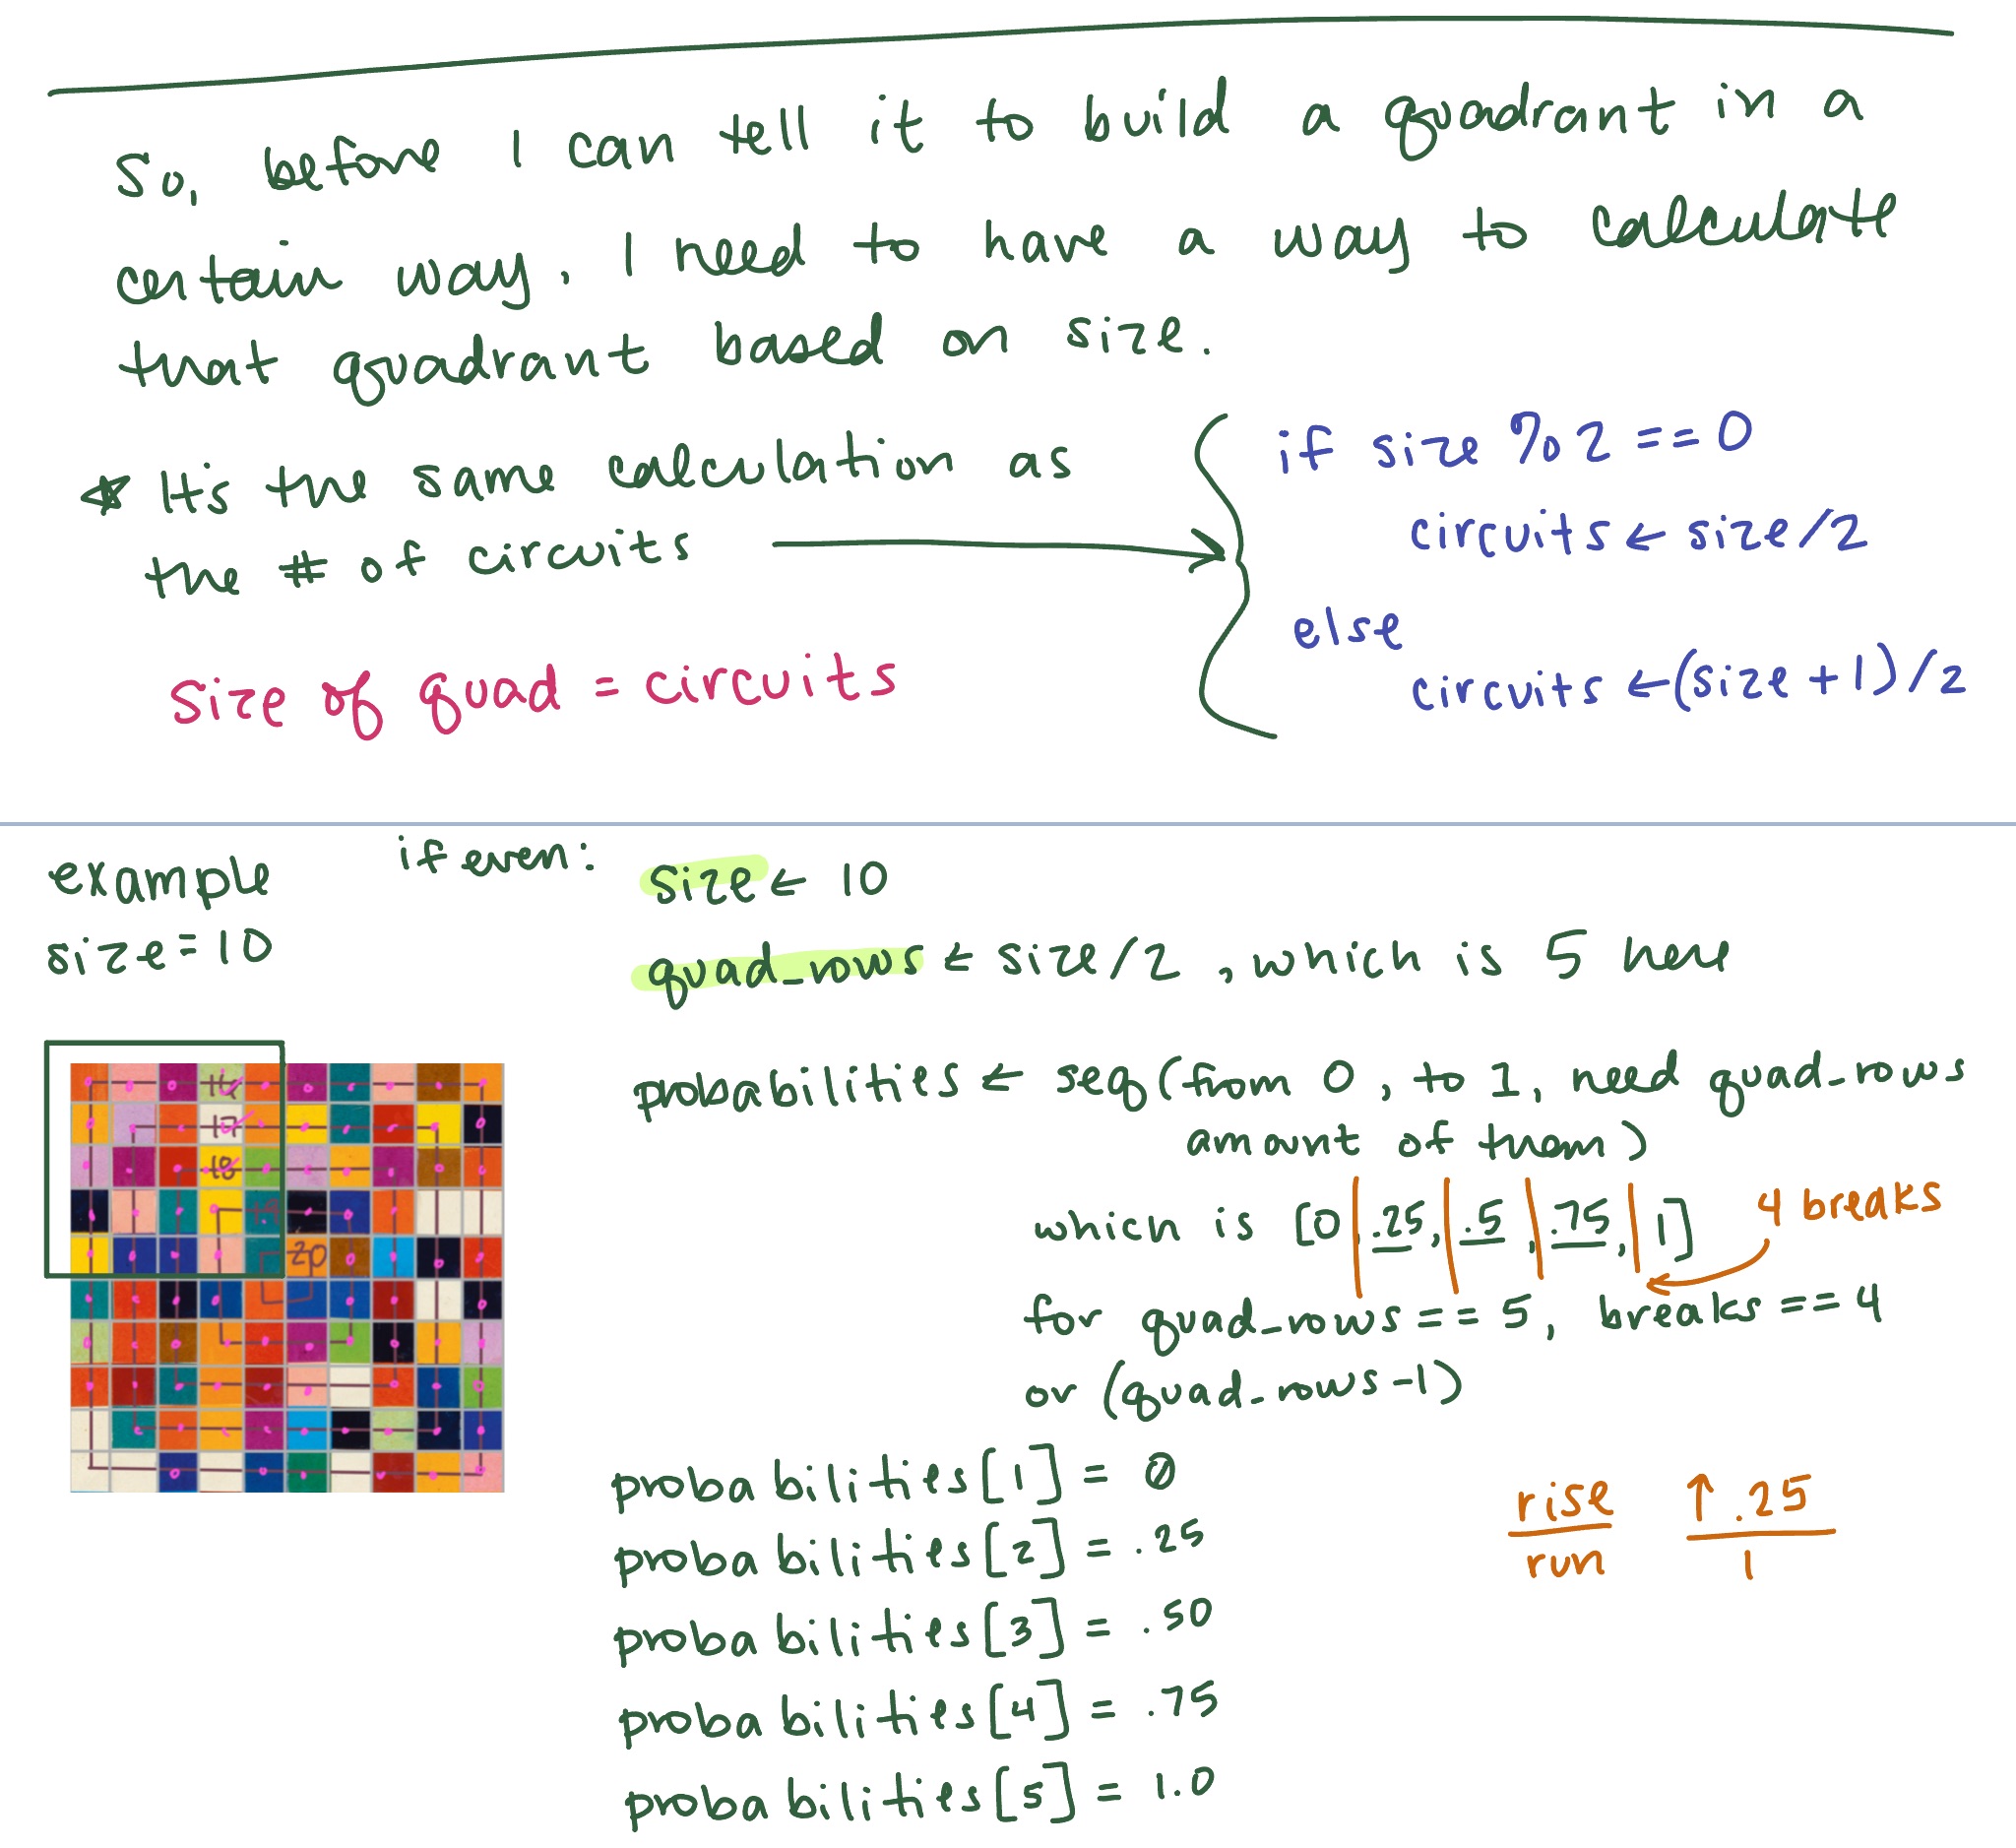
I knew I needed to create a matrix of probabilities with the outer circuits having a lower probability of containing a color than the central circuits. I also knew I needed to write parameterized code that would work for a variety of sizes, but my first goal was just to understand this 40 by 40 piece. What did the probability distribution look like from the outside to the inside? I was looking to explore stuff like that.
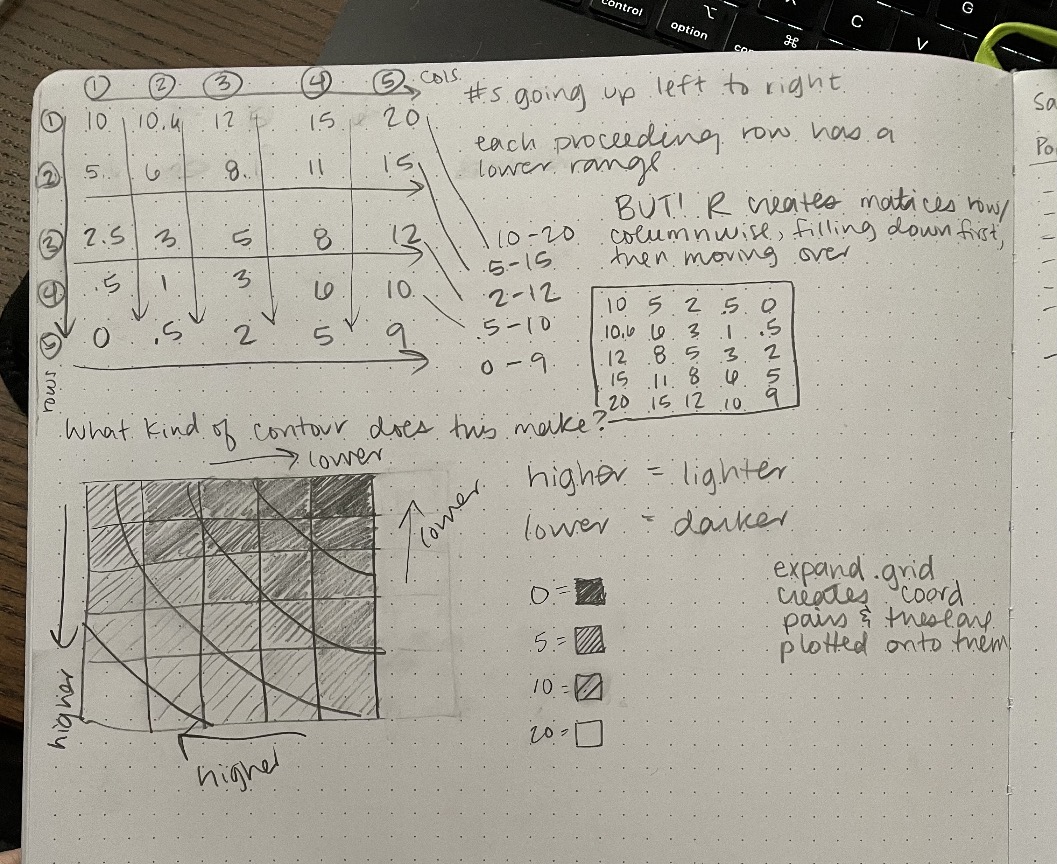
I realized that I didn’t really need to build my entire matrix in concentric circuits. I could just build one quadrant and then mirror it horizontally, then mirror that vertically. You’ll notice that I began grabbing smaller chunks of the photo of the artwork. I believe in working on the smallest version of a problem that I can. You’ve heard of a minimum viable product? I call this a minimal viable problem/example.
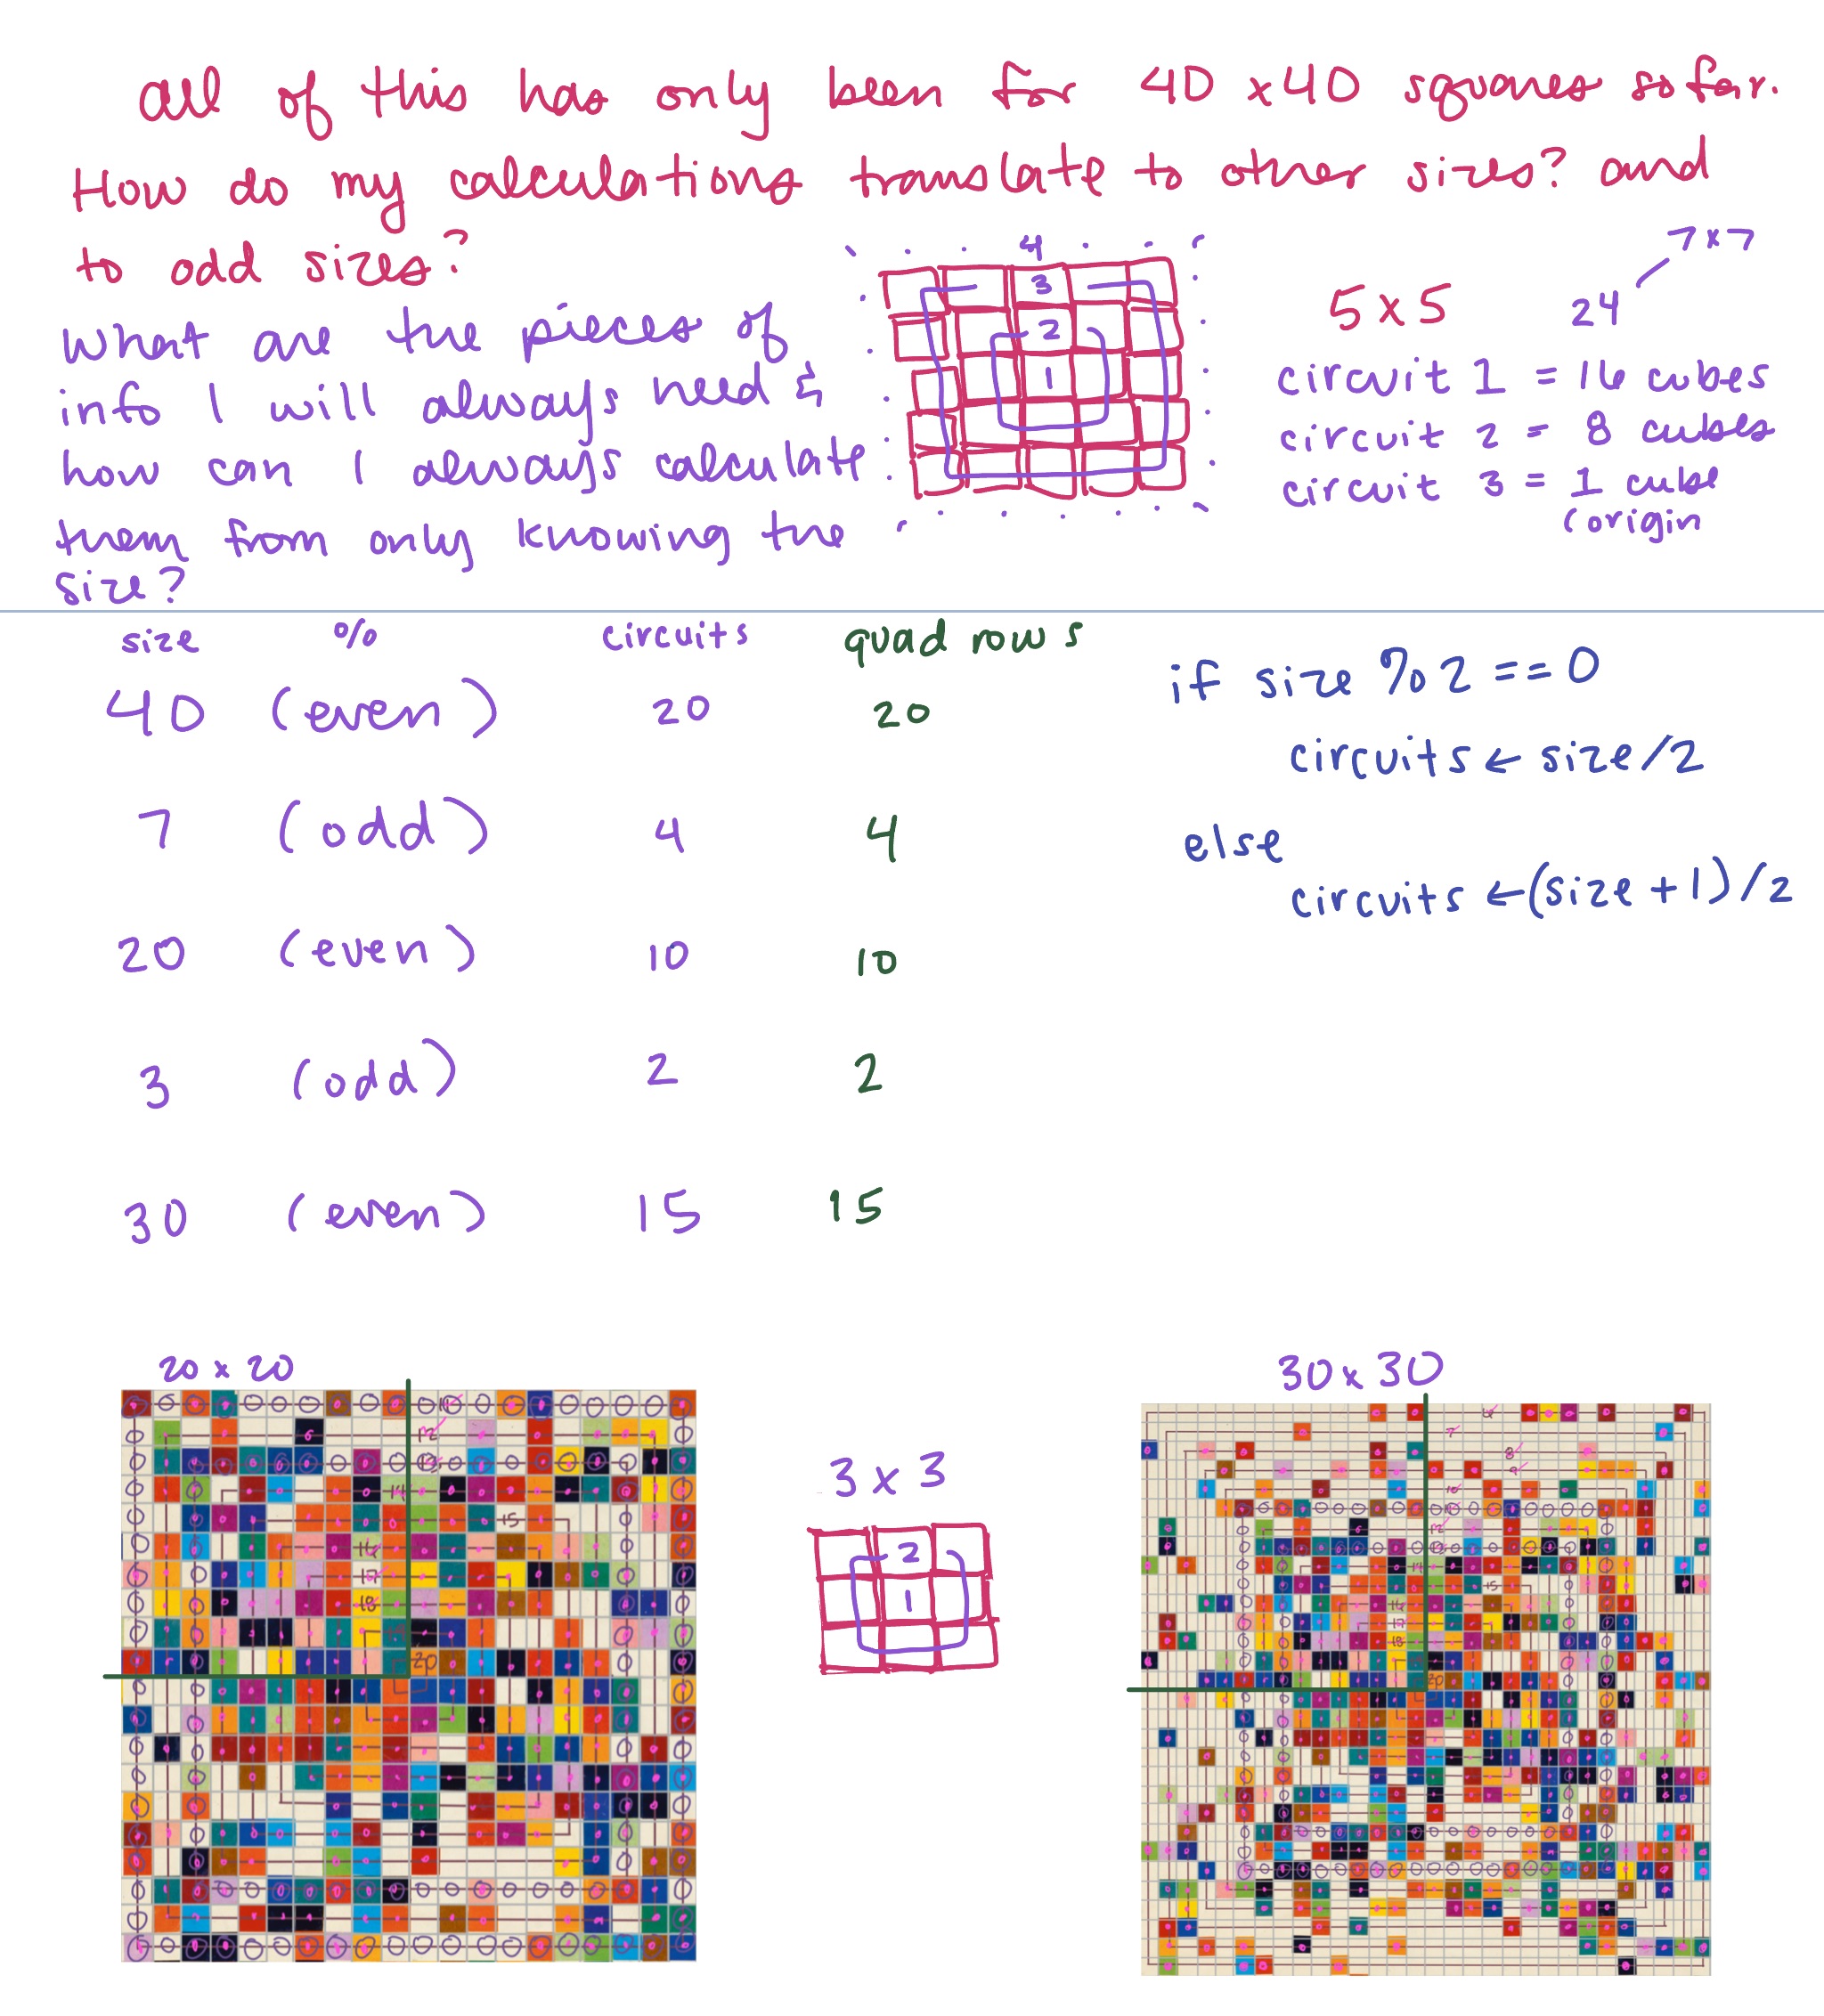
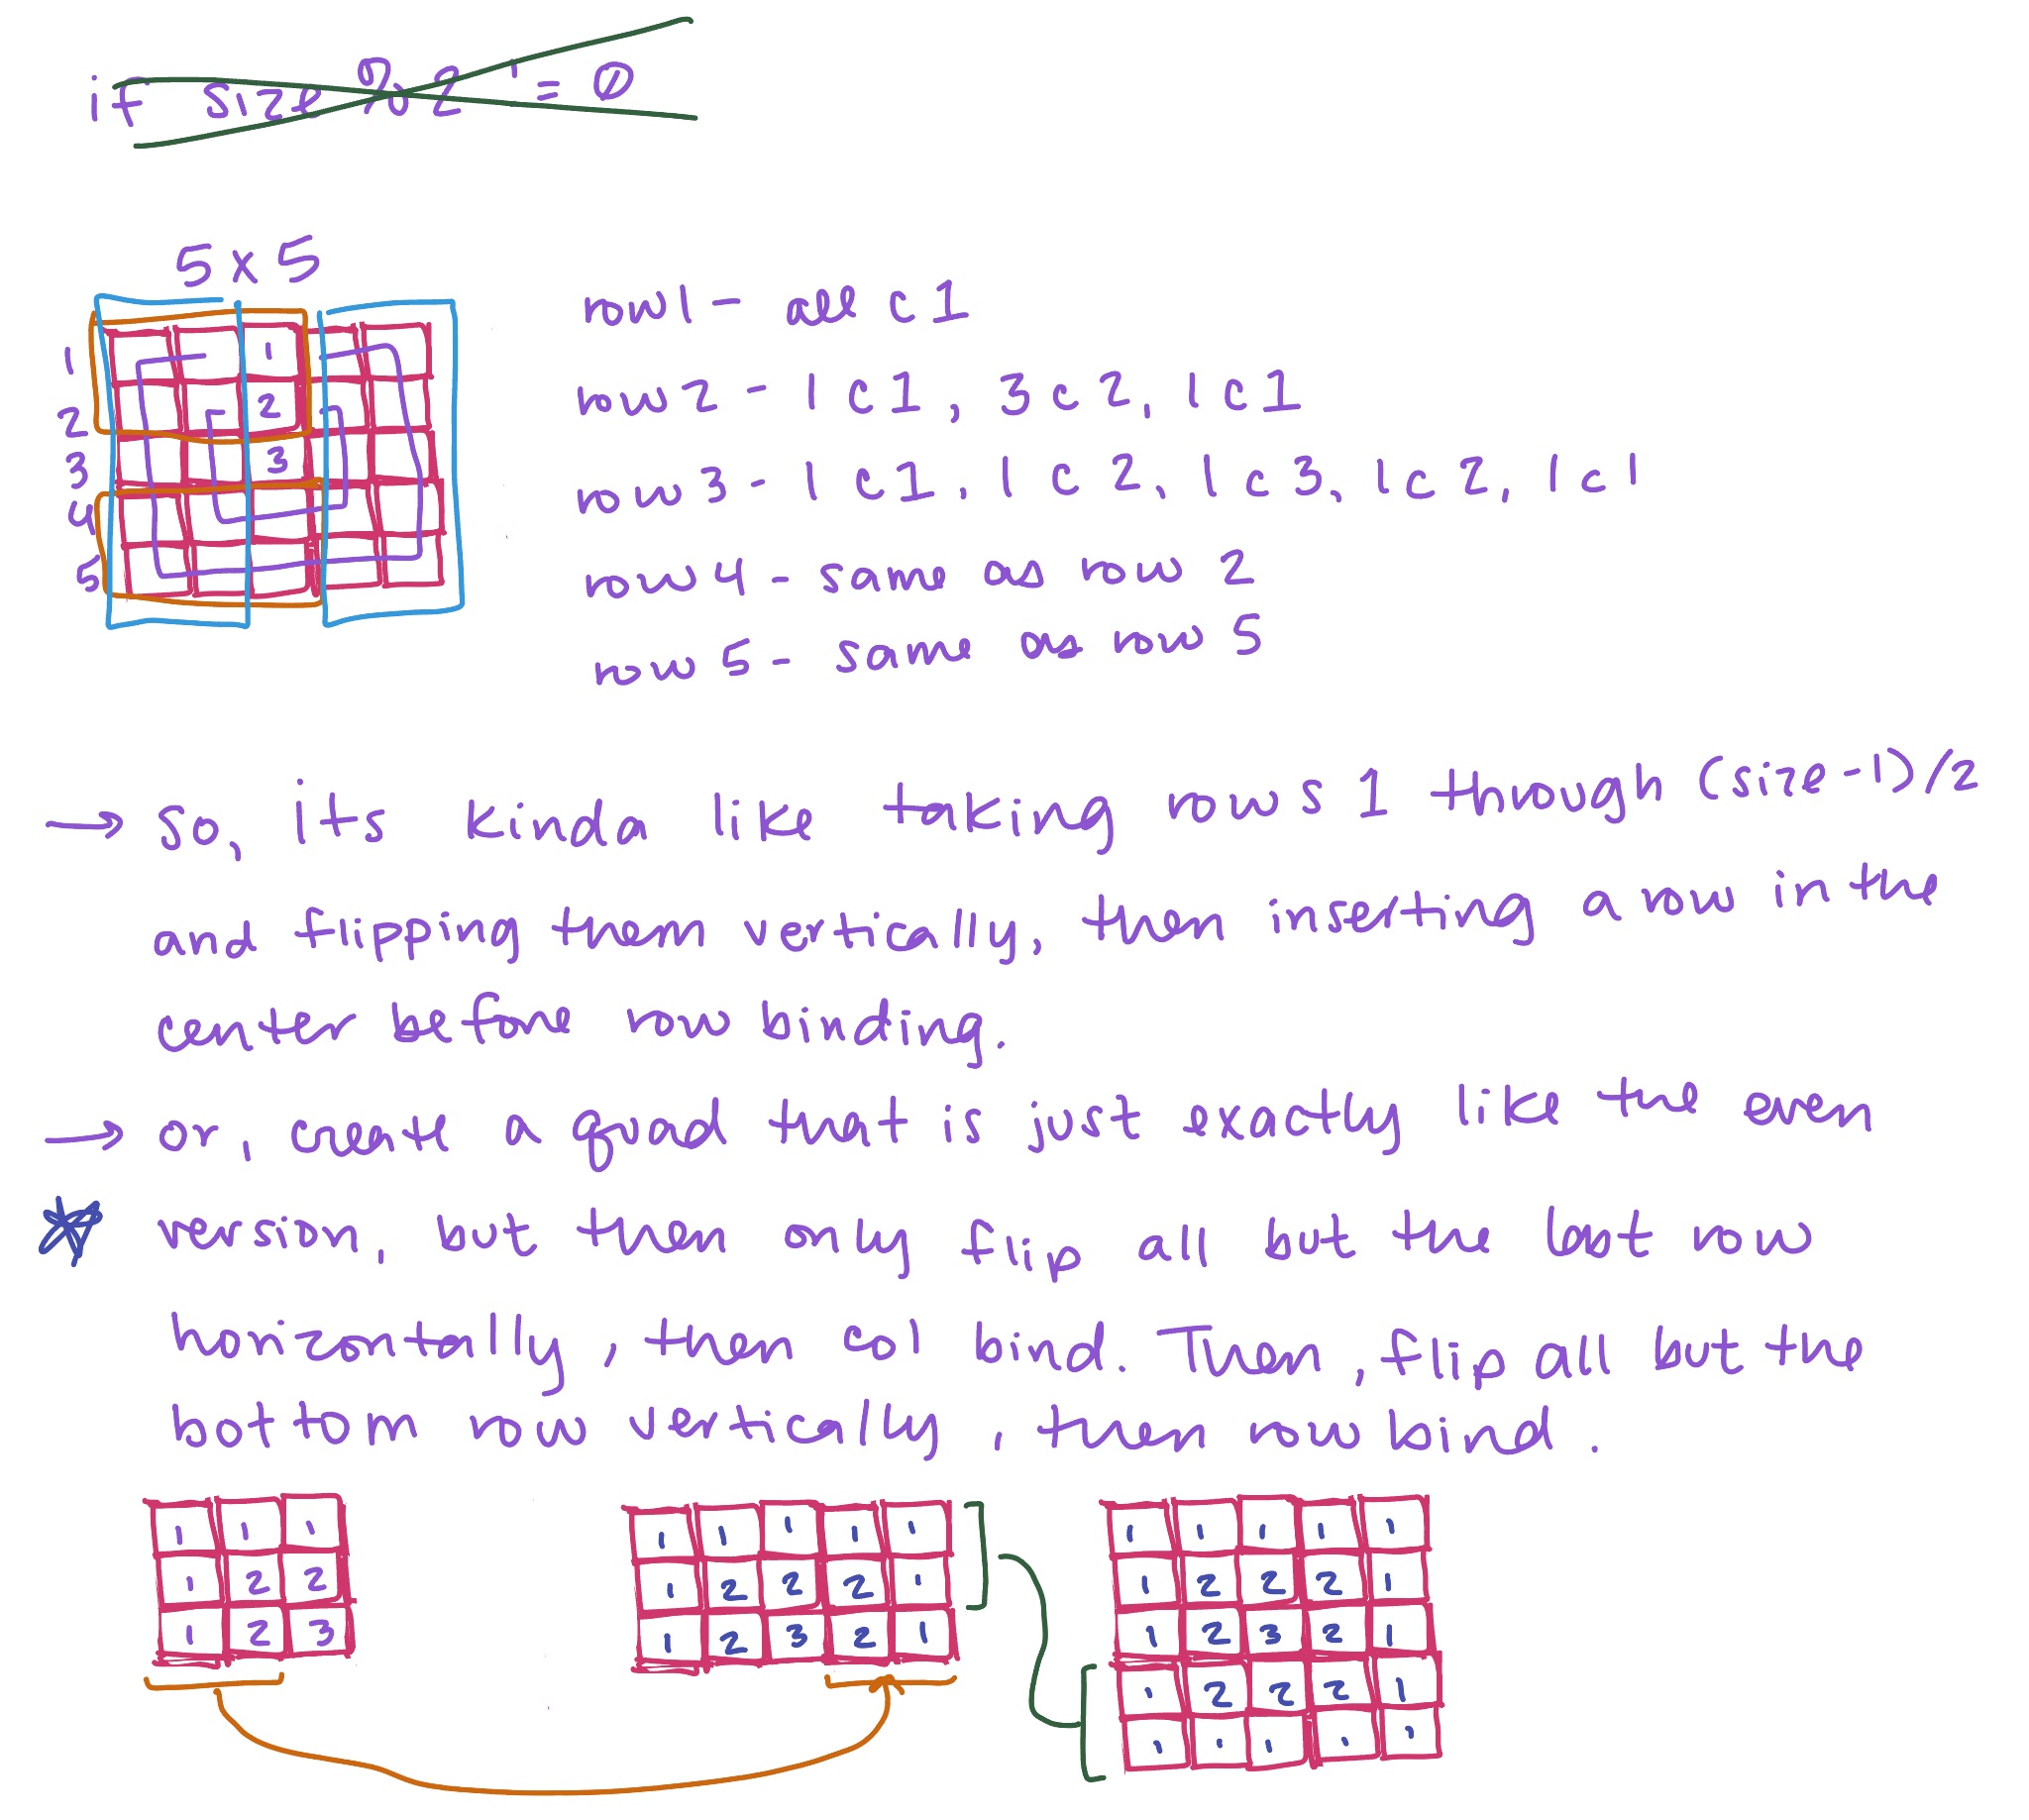
At first, I thought I might need one type of starting quadrant for building an even-numbered grid (say, 40 by 40) and another type of quadrant for building an odd-numbered grid (like 25 by 25). You can also see below how I started to note down functions that would do what I wanted.
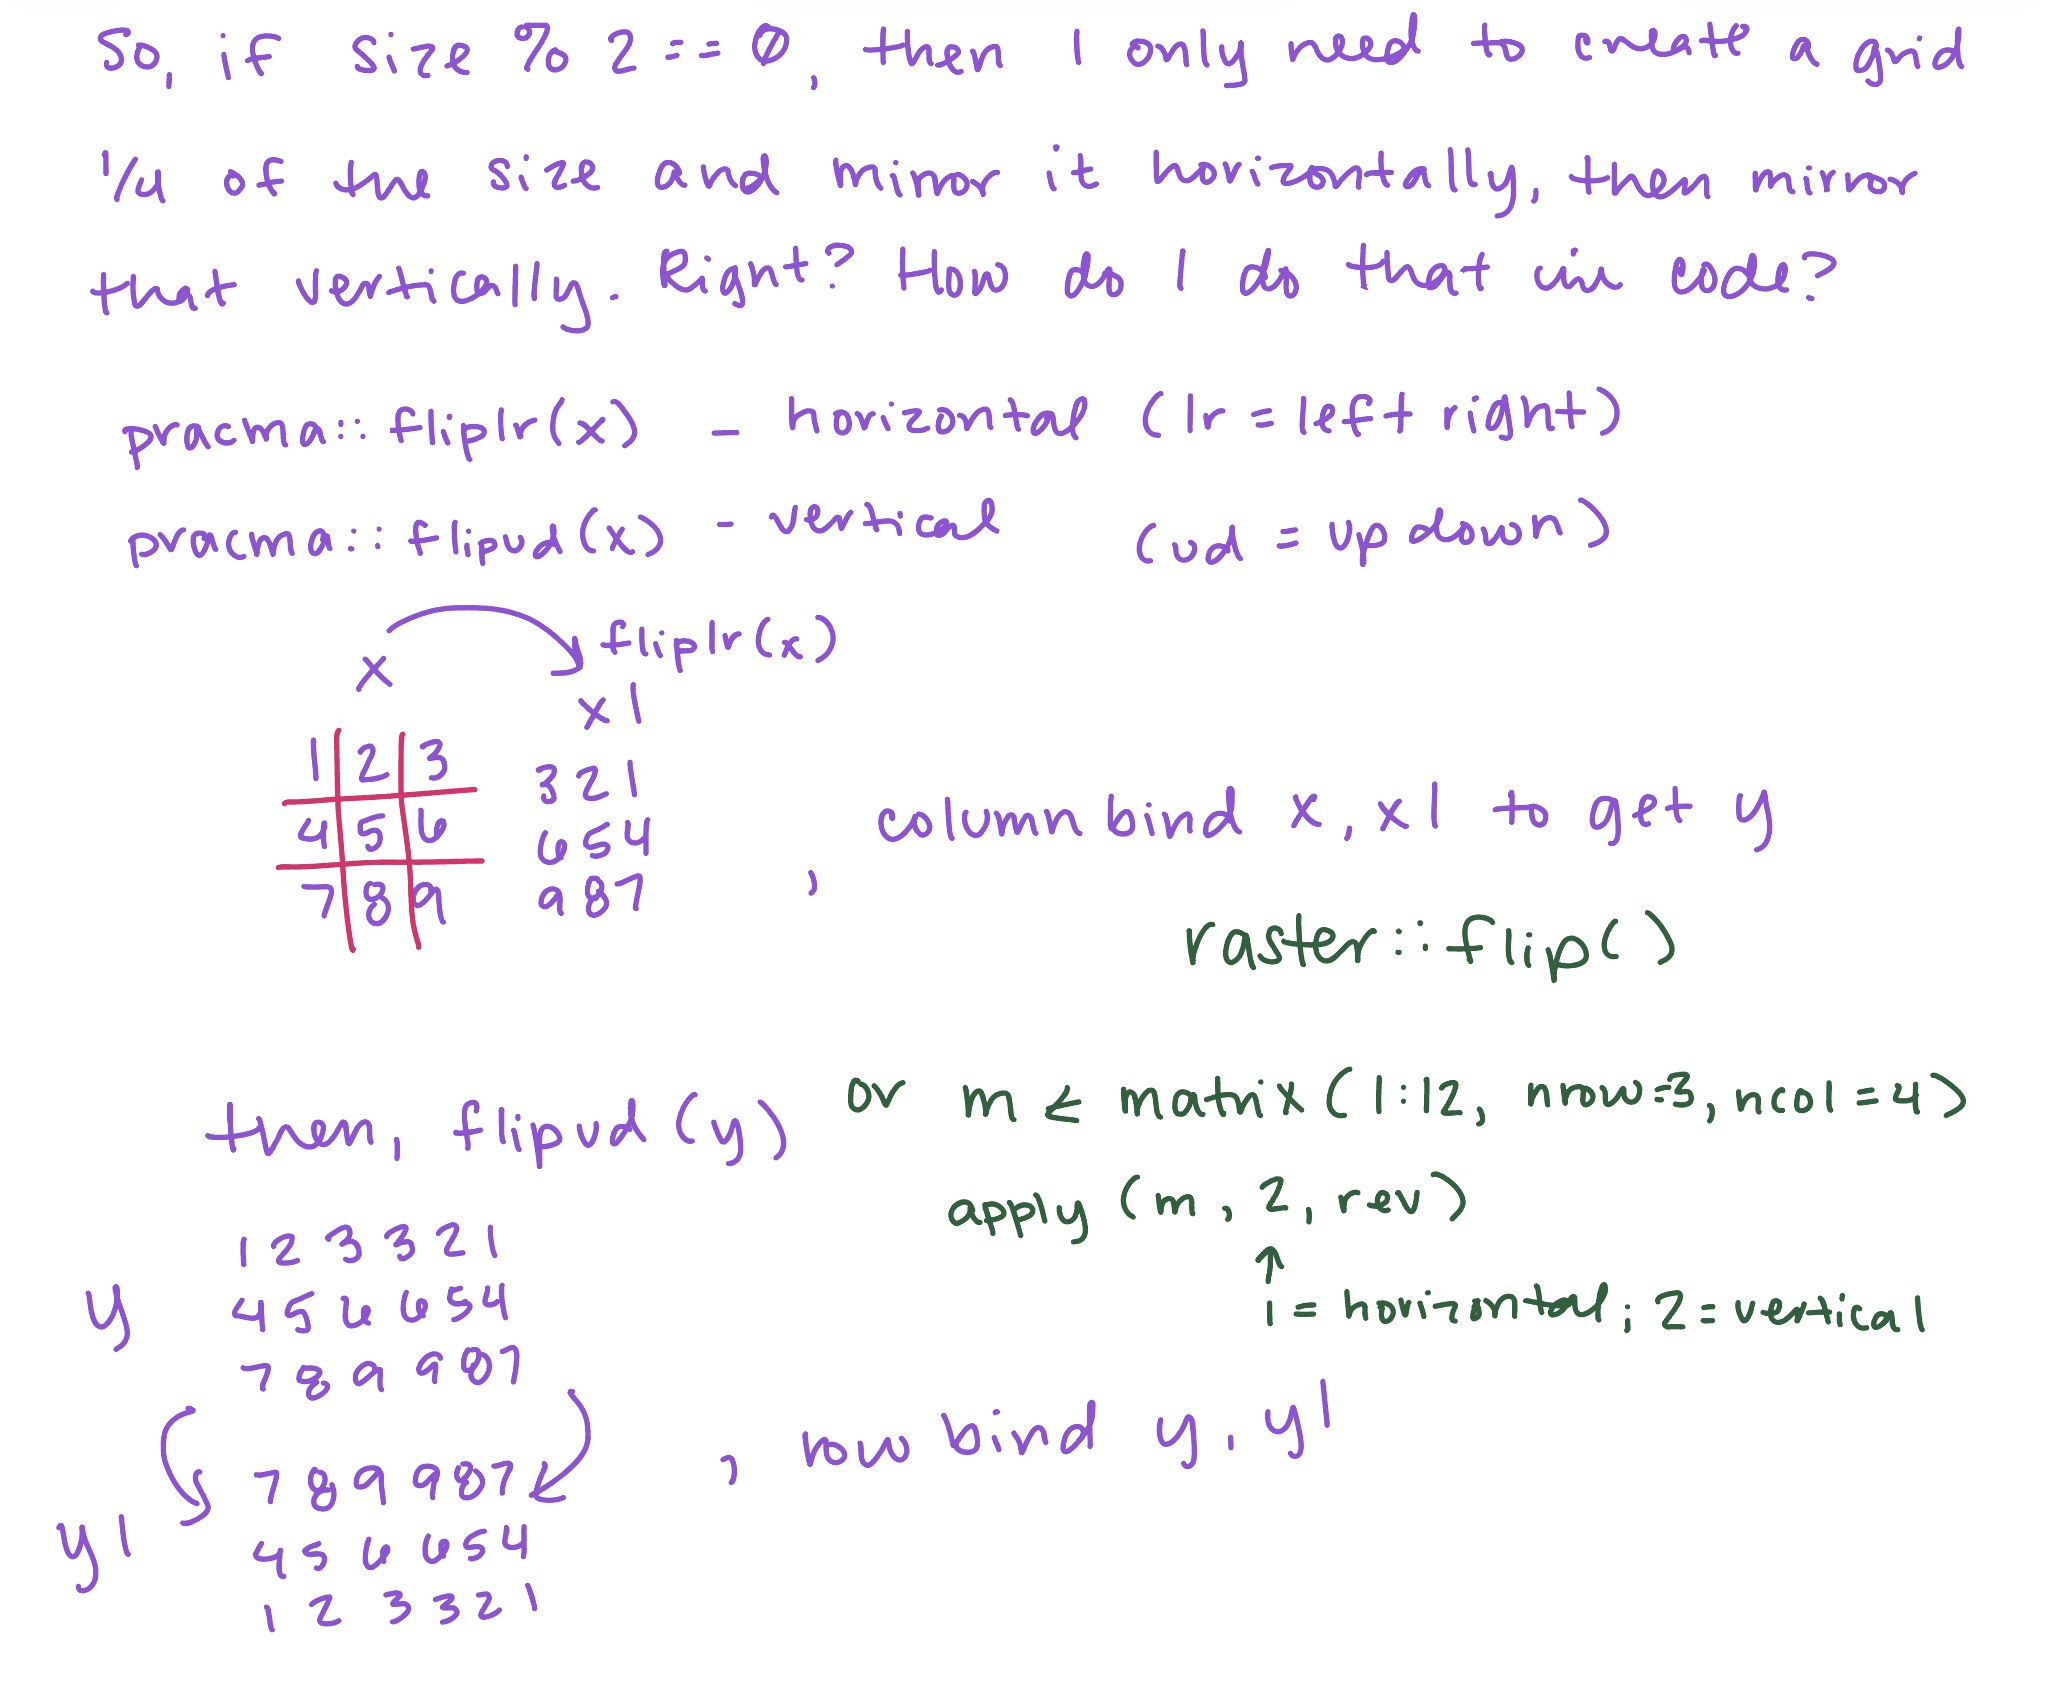
I quickly realized it doesn’t matter if my grid size is even or odd! I can start with the same quadrant either way. For odd-numbered grid sizes, I can just skip the last column when mirroring horizontally, and then skip the last row when mirroring vertically. My brain probably only got to this step because I was writing and drawing things out, NOT CODING. If I start coding too soon, I stall out.
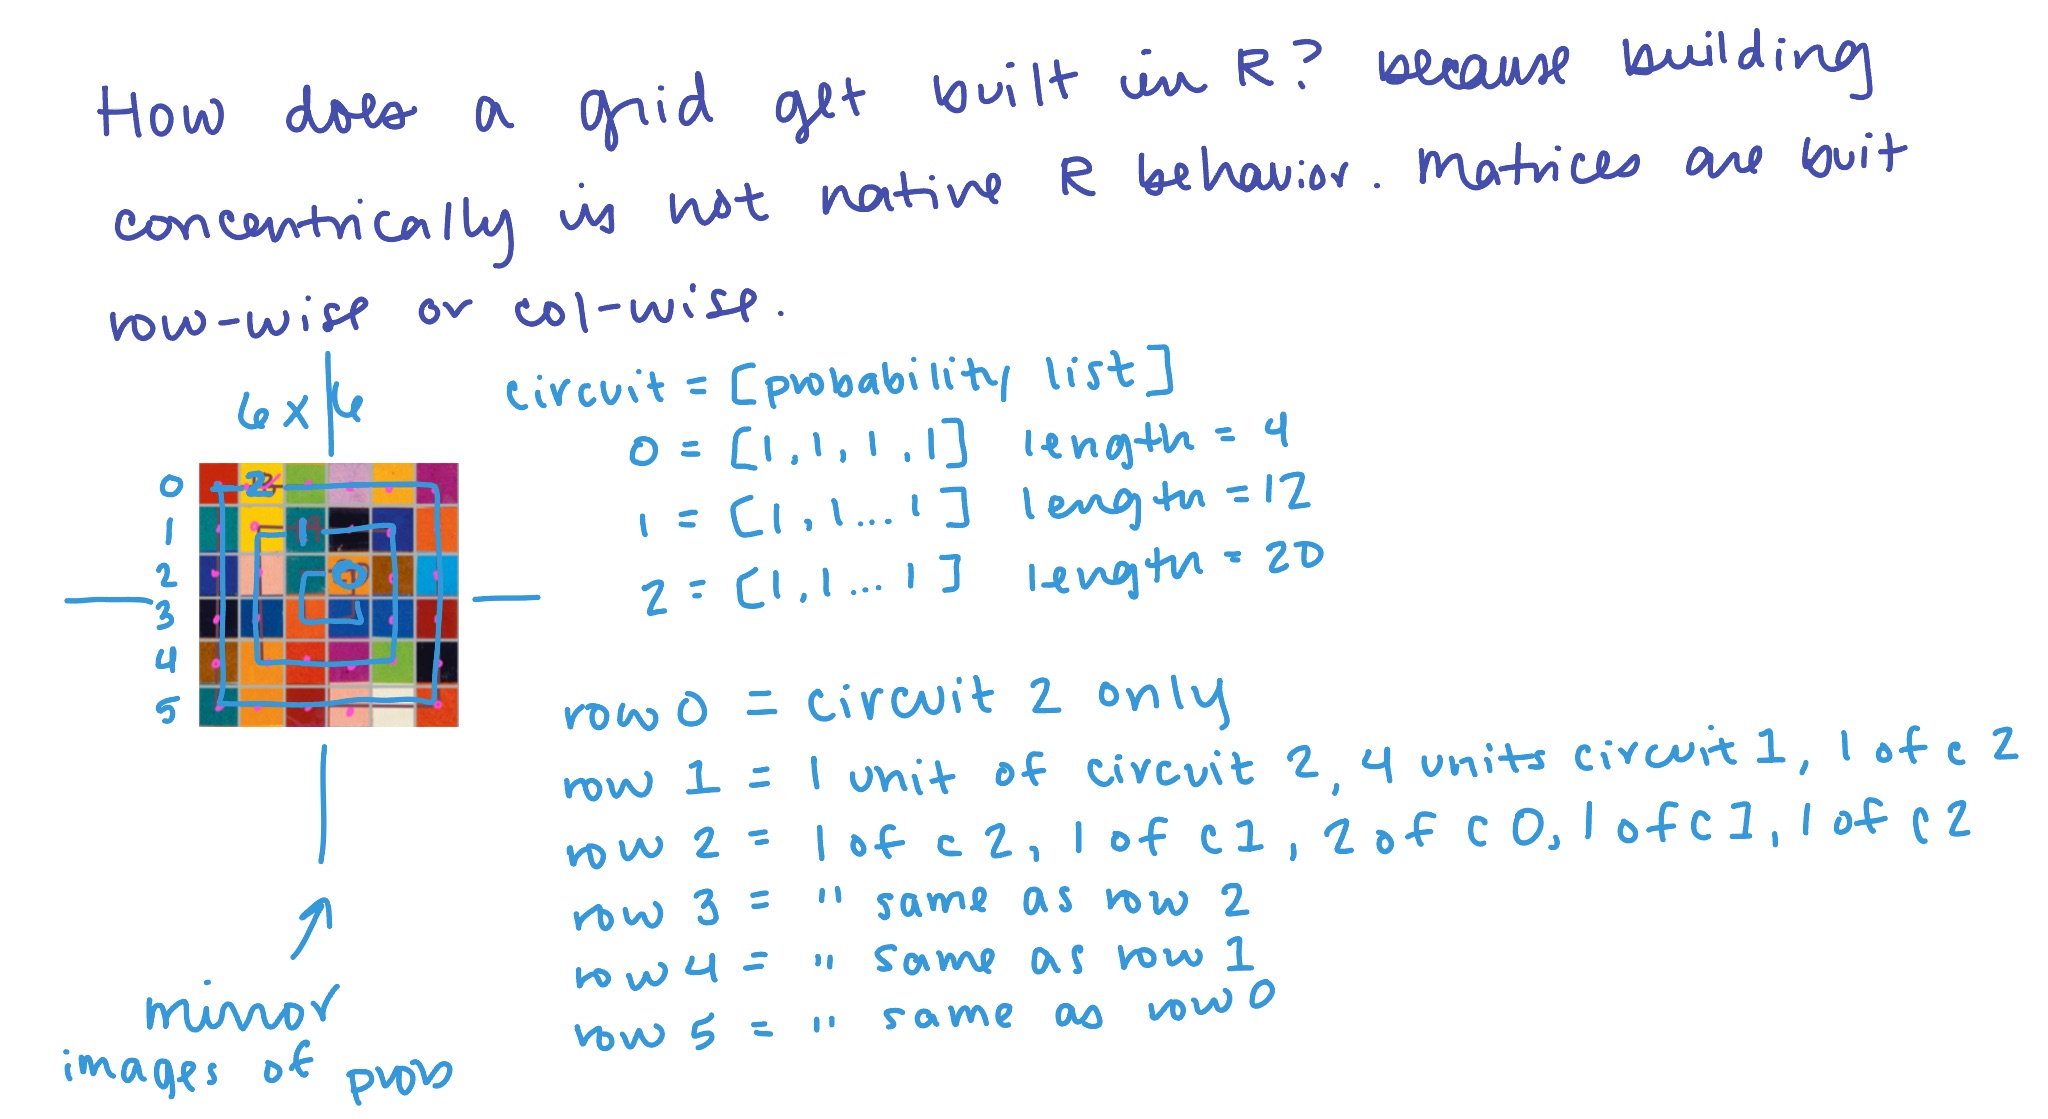
I still needed to figure out how this would look in code, so I began writing out my initial ideas of how assigning probabilities to circuits might work.
That code would work for spreading out the probability equally from the outside to the inside, but that’s not how Kelly’s piece III works. I began to analyze what the probabilities in the piece were. And by probabilities, we’re really just talking about proportions here. What proportion of the total number of cubes in a circuit are filled in with a color vs not filled in? You’ll see me call this probability instead of proportion for the majority of these notes, even though sometimes I mean probability and sometimes I mean proportion. Don’t come for me.
This is the point at which I finally went to R to start coding. That probably feels silly if you’re a person who jumps straight in to coding immediately, but I’ve learned over the years that coding too soon is the downfall of many projects. For me. Your mileage may vary 😉 Fair warning: I use a lot of comments. PROUD COMMENT QUEEN 👑
I started with code to create a grid of randomly assigned colors, sort of like Kelly’s piece VII (don’t worry, I’ll show you what it looks like in a second), but with just 8 colors plus white. Nothing worked at first, but I eventually got things going. I tried to sample as many unique colors as I could from piece “III” in the series to use as the colors. I wrote a function to define a matrix of colors by sampling from a list of possible colors.
In this initial function seen above, it returned a matrix, but I later changed it to return a vector. I realized that my initial code to create a data frame of coordinates and populate them with the colors was unnecessarily complex because my colors were in a matrix and they really didn’t need to be. Here is me putting those pieces together:
# Set the size of the grid
size <- 40

# Define the colors
colors <- c("#ece4cc",
            "#fccd02",
            "#b1c575",
            "#74aa3a",
            "#007b7b",
            "#0099d4",
            "#014d9c",
            "#0b0c18",
            "#9f1c6c",
            "#d2a1c0",
            "#952017",
            "#c3280b",
            "#eda29a",
            "#e4581c",
            "#955507",
            "#eb871b"
)

# Generate the color grid
color_grid <- generate_color_grid(size, colors)

# Create a data frame for the grid coordinates
df <- expand.grid(x = 1:size, y = 1:size)

# Add the corresponding color to each grid coordinate
df$color <- color_grid[cbind(df$x, df$y)]
# This is overly complicated, there's no need for this!
So, I changed my function to output a vector and then I was able to add that to my data frame of grid coordinates much more simply:
# Define a function to generate a random vector of colors
generate_color_vector <- function(size, colors) {

# Create a size^2 vector filled with a random sample of colors from a color list
  color_vector <- sample(x = colors,
                         # "size" is the # of squares on each side
                         size = size * size,
                         replace = TRUE)

  return(color_vector)
}

# Set the size of the desired grid
size <- 40

# Define the colors
colors <- c("#ece4cc",
            "#fccd02",
            "#b1c575",
            "#74aa3a",
            "#007b7b",
            "#0099d4",
            "#014d9c",
            "#0b0c18",
            "#9f1c6c",
            "#d2a1c0",
            "#952017",
            "#c3280b",
            "#eda29a",
            "#e4581c",
            "#955507",
            "#eb871b"
)

# Generate the color grid
color_vector <- generate_color_vector(size, colors)

# Create a data frame for the grid coordinates
df <- expand.grid(x = 1:size, y = 1:size)

# Add the corresponding color to each grid cell coordinate
df$color <- color_vector
I had only used geom_tile once before, while helping a student, and I’d only just learned how to create coordinates using expand.grid the year before while fumbling through learning contour plots.
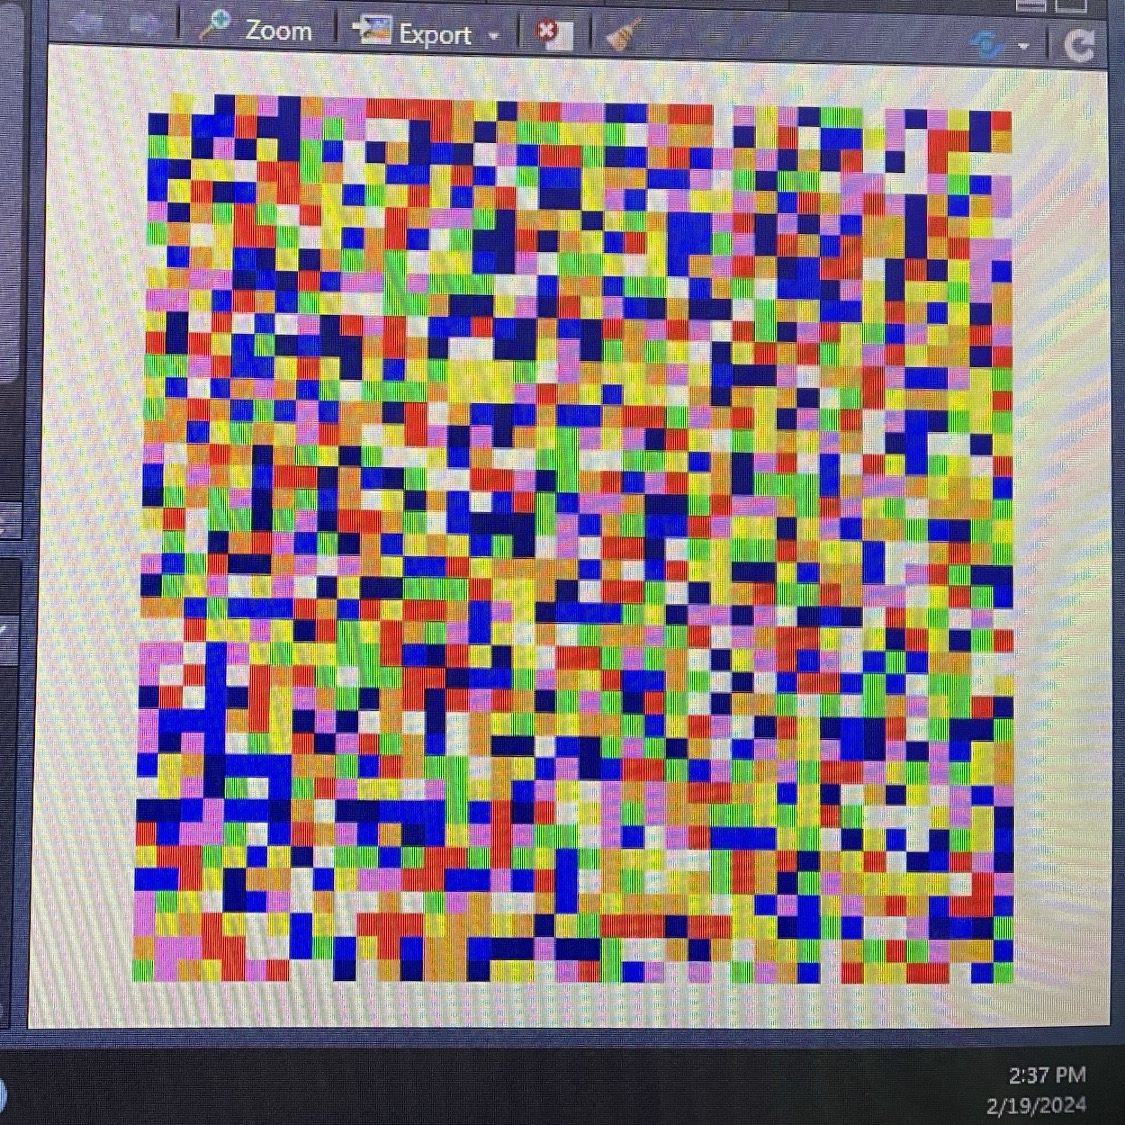
So, I rolled the dice and I let ChatGPT help me create a simple tile plot. It got lots of stuff wrong, but I fixed it until my plot worked and did what I wanted, resulting in this:
# Plot the grid
kelly_colors_VII <-
ggplot(df, aes(x = x, y = y, fill = color)) +
geom_tile() + # Add tiles
scale_fill_identity() + # Use colors stored as strings in the color col
theme_void() + # Remove axis labels and background
coord_equal() # Use equal aspect ratio
# Print the plot
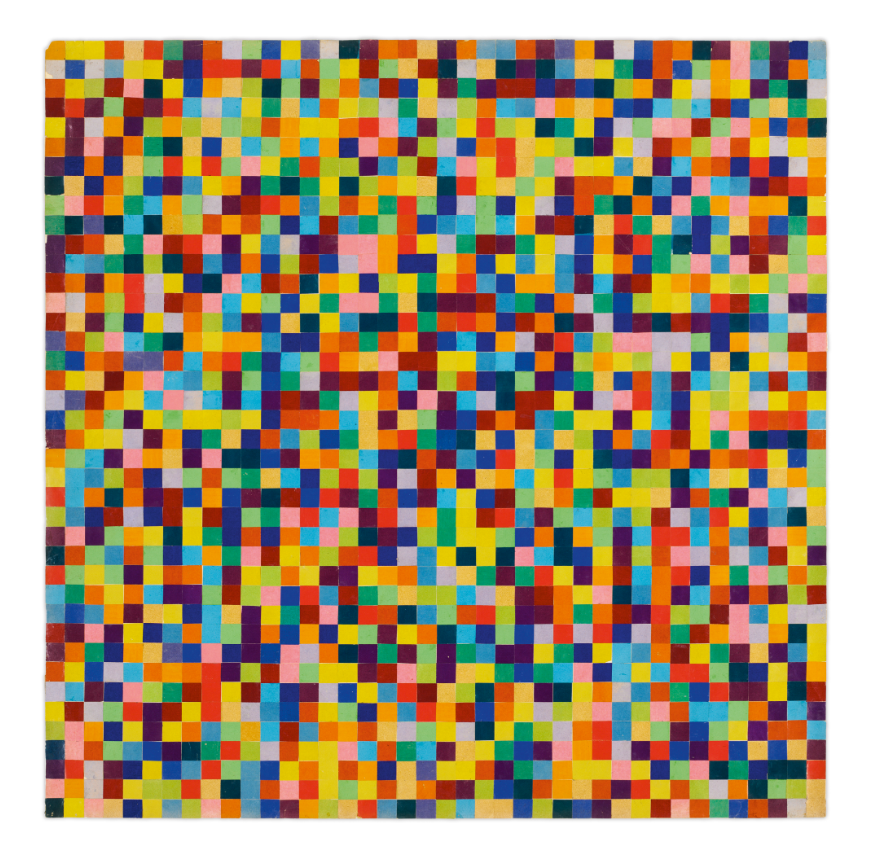
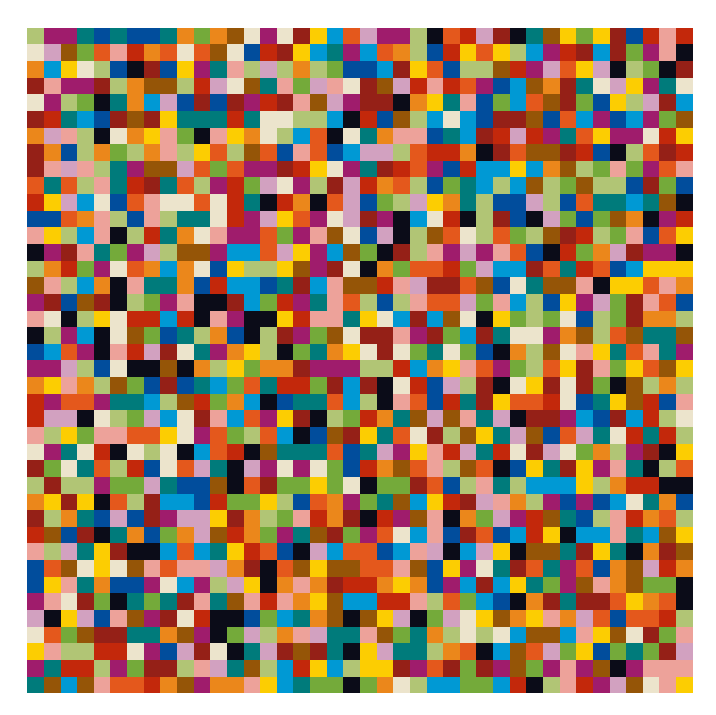
kelly_colors_VIIHere’s the initial result using just rainbow colors (on the left), and then the very first successful plot I got with my 16 sampled colors (on the right). I was sooooooo excited! I was too excited to even take screenshots, I just snapped photos with my phone to show off. I was drunk with power at this point.
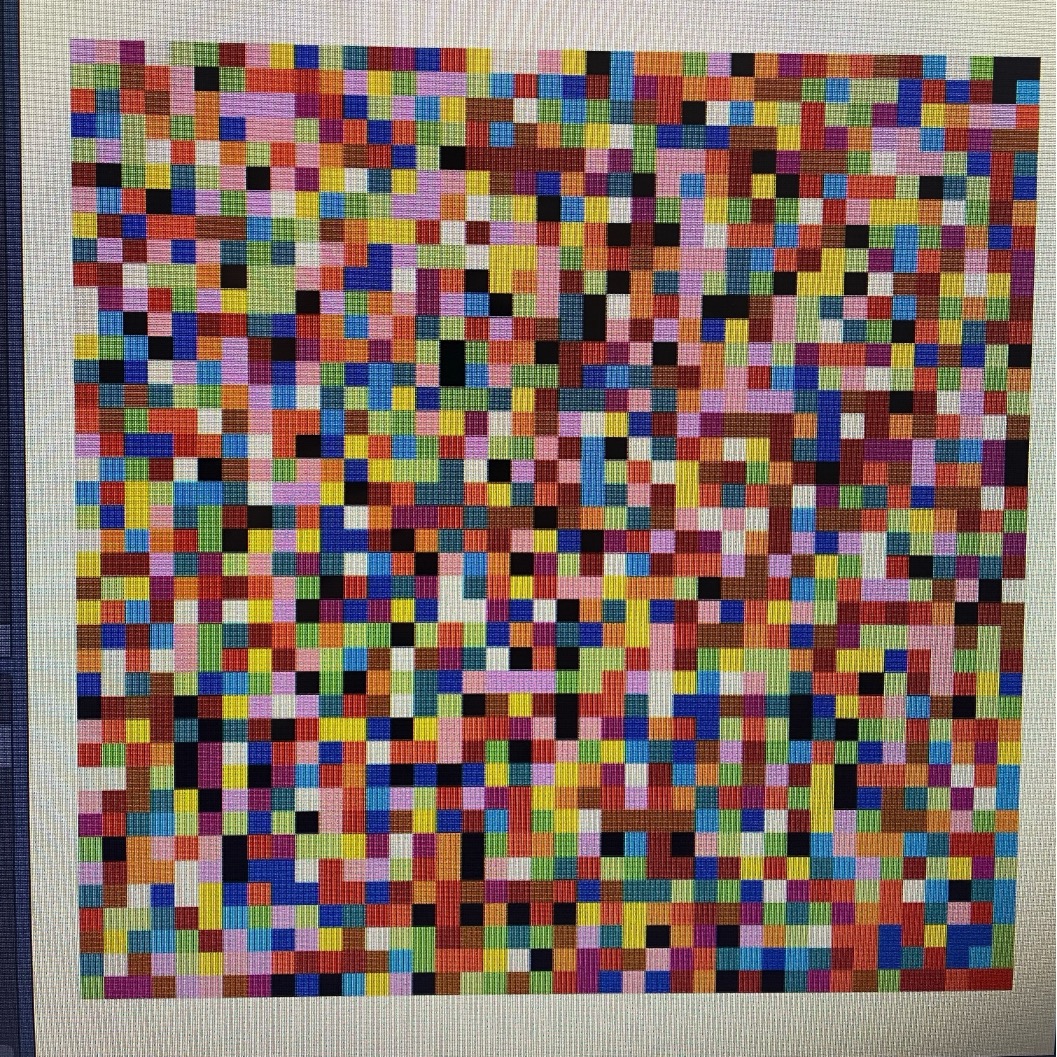
I DID IT! I MADE A THING THAT PROVES I CAN PROBABLY MAKE THE BIGGER THING! I did, eventually, remember to get a legitimate screenshot of my work, so here is Kelly’s original piece VII (again with the yellowing) and one of my first attempts at recreating it. I hadn’t realized at this point that piece VII has no white in it. I didn’t really care.
It was time to analyze the probabilities of the actual piece I was aiming for: piece III! But it was gonna have to wait until the next day. And so will the next blog post. I’ll link the second post in the series here, and here’s the app in its current form if you’d like to play with it!. Hope you enjoyed my mayhem!