library(ggplot2)
library(pracma)
source("R/01-functions.R")
# Define the size of the piece
size <- 40
circuits <- ifelse(size %% 2 == 0, size/2, (size+1)/2)
# Define the colors
background <- "#EDEFEE"
colors <- c(#"#EDEFEE", # Paper
"#1A8BB3", # Teal - no longer teal, just bright blue
"#0950AE", # Dark blue
"#4DACE5", # Light blue
"#126DDB", # Blue
"#E48DC4", # Pink
"#ABA9E8", # Light purple
"#872791", # Purple
"#6D1617", # Dark red
"#B81634", # Red
"#DF3B43", # Red orange
"#E35C47", # Orange
"#EB8749", # Light orange
"#F6E254", # Yellow
"#7B442D", # Brown
"#000000", # Black
"#1A6E7E", # Dark green - no longer dark green, now looks teal
"#7CBF7B", # Green
"#ADD2B8") # Light green
# Create a data frame for the grid coordinates
df <- expand.grid(x = 1:size, y = 1:size)
# Get the vector of probabilities based on the size of the piece
prob_vector <- get_prob_vector(circuits)
# Generate the color vector
color_vector <- get_color_vector(size, colors)
# Add the corresponding color to each grid cell coordinate
df$color <- color_vector
# Assign probabilities to matrix correctly
M <- get_prob_matrix(size, prob_vector)
# Apply prob matrix M to df as a vector
df$probs <- as.vector(M)
# Turn the piece VII vector into the piece III vector (white squares)
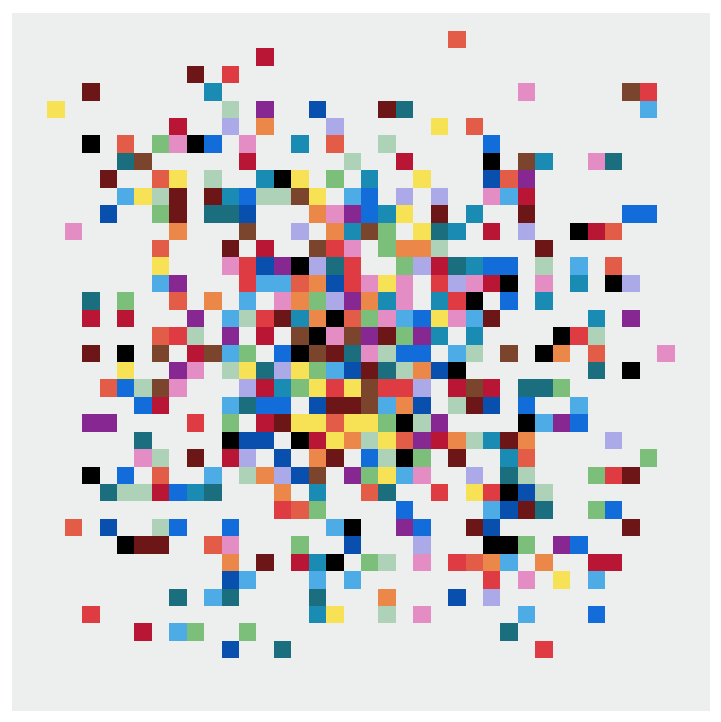
final_df <- get_kelly_III_vector(df, background)
#####################################################################
# Add numbers to the colors
convert_colors_to_numbers <- function(colors) {
# Turn colors into numbers, but assign NA to background color
color_numbers <- as.numeric(factor(colors, levels = unique(colors[-which(colors == background)])))
# Change all NA values to the letter "B"
color_numbers <- ifelse(is.na(color_numbers), "B", color_numbers)
return(color_numbers)
}
final_df$color_numbers <- convert_colors_to_numbers(final_df$color)
# Create the pbn plot
paint_by_numbers <-
ggplot(final_df, aes(x = x, y = y, fill = color, label = color_numbers)) +
geom_tile(alpha = 0.5, color = "black") + # Add tiles
geom_text(size = 2.6) +
scale_x_continuous(position = "top",
expand = c(0,0),
breaks = 1:nrow(final_df)) +
scale_y_reverse(expand = c(0,0),
breaks = 1:nrow(final_df)) +
scale_fill_identity() + # Use the colors stored as strings in the color column
#theme_void() + # Remove axis labels and background
coord_equal() + # Use equal aspect ratio
labs(x = NULL, y = NULL) +
theme(panel.grid.major = element_blank(),
panel.grid.minor = element_blank(),
axis.text.x = element_text(angle = 90))The Ellsworth Project: Part 7
R
Shiny
Documenting the creation of The Ellsworth App, in which I finish the paint-by-numbers plot and the swatch plot.
March 1st, 2024
Working on the paint-by-numbers plot today, or “pbn plot” as I’ve begun calling it. I need to assign a number to each color and then add a column to the data frame that I am plotting that contains those numbers as strings, and then I need to print them within tiles as geom_text or something.
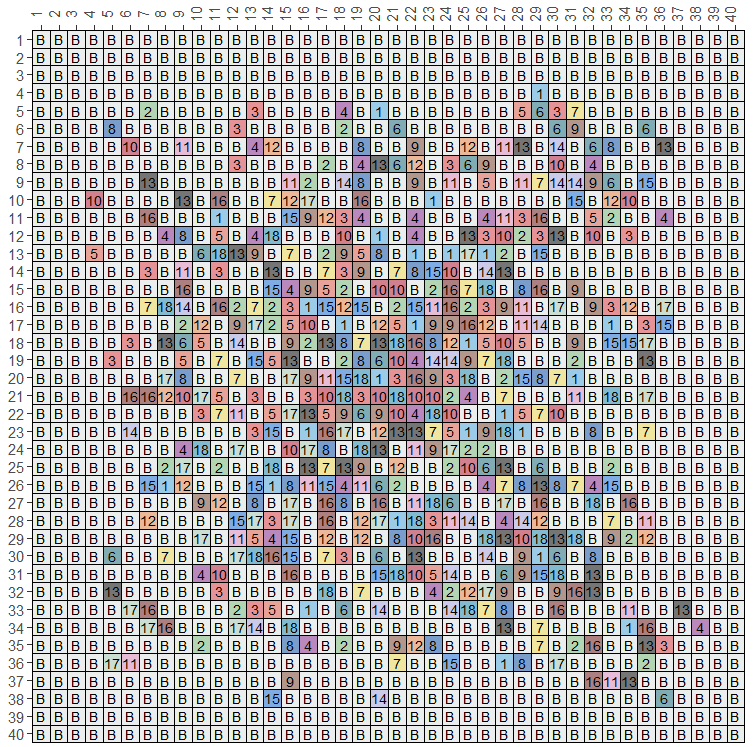
BAM! I think that looks great. I’d find that really helpful if I was planning a quilt or something. I do know, however, that this plot will not work past a certain size if I want the user to be able to download a PDF to US letter or A4 size. I think I should do some tests to see what the maximum printable size will be, but that’s not a priority. I’m sure there is a way to allow them to print any size and just tape together multiple printed pages, but I don’t want to worry about that. If I can only go to 40 x 40 grids and I want a 100” by 100” quilt, I’ll just do the math to see how many inches wide each of my squares needs to be. Quilters are math whizzes, I’m not worried about them.
Wish I knew more about plotting, saving images, and printing. Oh, well, that’s another project. As long as I set a size = 40 grid to print an 8” square grid, I know things will work for folks. I tried up to size = 60 and it worked. I can set these limits when I build the app by constraining the min and max of my sliders (or whatever I use) to a min of 13 and a max of 60.
Now, I am going to do something scary. I’m going to update {ggplot2}. Ok, nothing broke! SHEW.
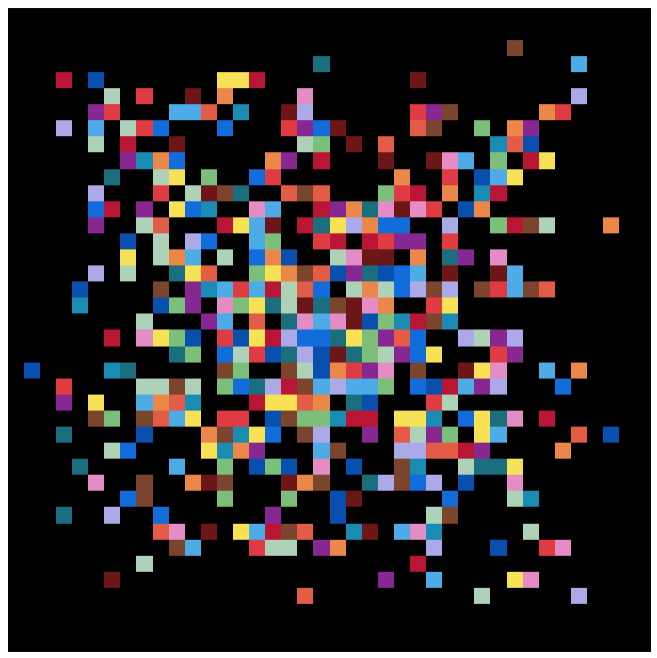
I also just updated the color assignment script so that if the background is paper white, the colors includes black, but if the background is black, black is removed from the color list.
# Define the colors
background <- "black" #EDEFEE"

if (background == "#EDEFEE"){ # If background is paper white
  colors <- c(#"#EDEFEE", # Paper
    "#1A8BB3", # Teal - no longer teal, just bright blue
    "#0950AE", # Dark blue
    "#4DACE5", # Light blue
    "#126DDB", # Blue
    "#E48DC4", # Pink
    "#ABA9E8", # Light purple
    "#872791", # Purple
    "#6D1617", # Dark red
    "#B81634", # Red
    "#DF3B43", # Red orange
    "#E35C47", # Orange
    "#EB8749", # Light orange
    "#F6E254", # Yellow
    "#7B442D", # Brown
    "#000000", # Black
    "#1A6E7E", # Dark green - no longer dark green, now looks teal
    "#7CBF7B", # Green
    "#ADD2B8") # Light green
} else { # else (if black), remove black from colors
  colors <- c(#"#EDEFEE", # Paper
    "#1A8BB3", # Teal - no longer teal, just bright blue
    "#0950AE", # Dark blue
    "#4DACE5", # Light blue
    "#126DDB", # Blue
    "#E48DC4", # Pink
    "#ABA9E8", # Light purple
    "#872791", # Purple
    "#6D1617", # Dark red
    "#B81634", # Red
    "#DF3B43", # Red orange
    "#E35C47", # Orange
    "#EB8749", # Light orange
    "#F6E254", # Yellow
    "#7B442D", # Brown
    #"#000000", # Black
    "#1A6E7E", # Dark green - no longer dark green, now looks teal
    "#7CBF7B", # Green
    "#ADD2B8") # Light green
}
I will obviously need to make this more clear once it’s all inside the app, but as it will be an input with a default, none of the commenting out of stuff will really be needed.
Next small target: get the numbers that correspond to the hex colors to print with the palette plot, or at least in a stand alone table. Might need to dig into the hues package and modify something.
hues::swatch
function (x)
{
    par(mai = c(0.2, max(strwidth(x, "inch") + 0.4, na.rm = TRUE),
        0.2, 0.4))
    barplot(rep(1, length(x)), col = rev(x), space = 0.1, axes = FALSE,
        names.arg = rev(x), cex.names = 0.8, horiz = T, las = 1)
    return(invisible(NULL))
}
March 8th, 2024
SHEW! What a ride the last week has been. My laptop kicked the bucket for good this time and I had to get a new one and set it up. I’m still not used to it. Switching back to a Mac after a decade of being on Windows has been disorienting, and I never coded on a Mac back when I used them daily.
My next task is to get the colors that correspond to the numbers to print on the palette grid, so let’s do that. Then, I really need to organize my file and send them off to my generous friend Santiago for a code review! I kind of have no idea how to organize things in their pre-app state, so I’m going to have to take some notes to figure it out.
So, as I looked at last time, here’s the swatch function in the hues package, which is thankfully VERY basic base R 🥳 baseR4LYFE. Let me comment on what’s happening here because I need to google some of these functions and refresh myself on what they do.
hues::swatch
function (x) # x is a vector of colors
{
        # set plotting parameters
    par(

    # mai specifies the margins in inches as (bottom, left, top, right)
    mai = c(0.2, # bottom margin == .2"
                    # left margin == the width in inches of the longest color name + .4"
                    max(strwidth(x, "inch") + 0.4, na.rm = TRUE),
                0.2, # top margin == .2"
                0.4))# right margin == .4"

    # create a bar plot
    barplot(
        rep(1, length(x)), # create as many bars of height 1 as there are colors
        col = rev(x), # color the bars using the vector of colors in reverse order
        space = 0.1, # keep 10% (.1) of each bar's height as space between the bars
        axes = FALSE, # Don't draw an axis line
      names.arg = rev(x), # labels below each bar; colors vector in reverse order
      cex.names = 0.8, # expansion factor for bar labels; shrink to 80% (.8)
      horiz = T, # draw bars horizontally (first bar goes at the bottom)
      las = 1) # specify the orientation of the bar labels (1 = horizontal)

    return(invisible(NULL)) # don't print the plot if it's just being assigned
}
So, now I know exactly what everything does and I know I can create a function that does this, plus adds the color number, by letting the function accept two arguments, the color column and the color number column, and then using a paste function to add the color number to the names.arg option.
One problem: the way I’ve written the convert_colors_to_numbers() function, it doesn’t apply to the original vector of possible colors, it applies to the colors column of the entire data frame, which maybe isn’t ideal. That means I don’t have a vector of color numbers in the same order as their colors. If I rewrote that function to create a matching vector of color numbers, I’d have to rewrite the functions that assign colors to also assign color numbers as a list, and I don’t particularly want to do that, just for readability.
What else could I do after-the-fact? I could go into the final_df data frame and find the unique colors and their color numbers.
# Get a df of just the unique colors and their numbers
colors_and_numbers <- unique(final_df[,c('color','color_numbers')])

# Function to plot the palette with it's numbers, based on hues::swatch()
plot_number_swatch <- function (x) # df containing two rows, color & color numbers
{
        # create labels vector
        labels <- paste0(x[[2]], ": ", x[[1]])

        # set plotting parameters
    par(

    # mai specifies the margins in inches as (bottom, left, top, right)
    mai = c(0.2, # bottom margin == .2"
                    # left margin == the width in " of the longest color+number combo name + .4"
                    max(strwidth(labels, "inch") + 0.4, na.rm = TRUE),
                0.2, # top margin == .2"
                0.4),# right margin == .4"
        family = "Courier") # Just trying to ensure monospaced font

    # create a bar plot
    barplot(
        rep(1, nrow(x)), # create as many bars (of height 1) as there are colors
        col = rev(x[[1]]), # color the bars using the vector of colors in reverse order
        space = 0.1, # keep 10% (.1) of each bar's height as space between the bars
        axes = FALSE, # Don't draw an axis line
      names.arg = rev(labels), # labels below each bar; colors vector in reverse order
      cex.names = 0.8, # expansion factor for bar labels; shrink to 80% (.8)
      horiz = T, # draw bars horizontally (first bar goes at the bottom)
      las = 1) # specify the orientation of the bar labels (1 = horizontal)

    return(invisible(NULL)) # don't print the plot if it's just being assigned
}

plot_number_swatch(colors_and_numbers)
Ok, good enough for me! I’m envisioning this as a second iteration of the app. I need to get a functioning app first, one that just creates the pieces using the pre-determined color palette. The “extra” iterations can be adding things like custom colors, the “paint-by-number” plot, and the palette swatch thing.
[Note from Future Libby: Well, this is it. This is the last “old” bit of documentation from last year. I had to step away from this project after the spring of 2024, and I’ve only now been able to get back to it in June of 2025. It’s time!]
I can’t believe I’m saying this, but I guess I’ll add an eighth part to this series to show you my notes on the app code 😅 but here’s the app in its current form if you’d like to play with it!